. 1999 Jun 8;96(12):6920-4.
doi: 10.1073/pnas.96.12.6920.

Myocardial infarction mediated by endothelin receptor signaling in hypercholesterolemic mice

Affiliations

Myocardial infarction mediated by endothelin receptor signaling in hypercholesterolemic mice

G Caligiuri et al. Proc Natl Acad Sci U S A. .

Abstract

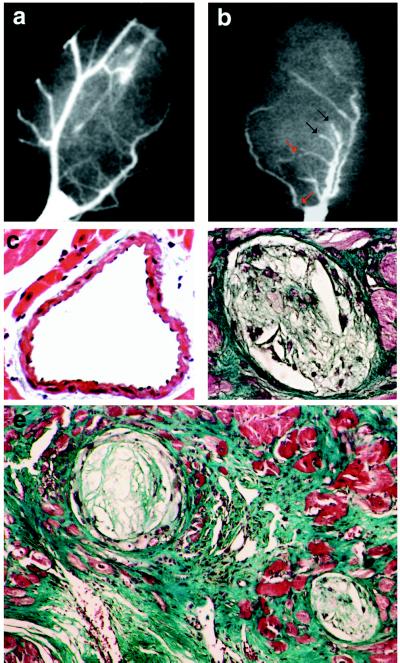
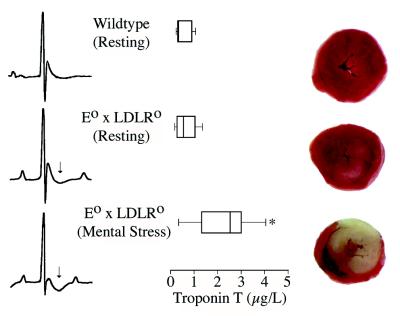
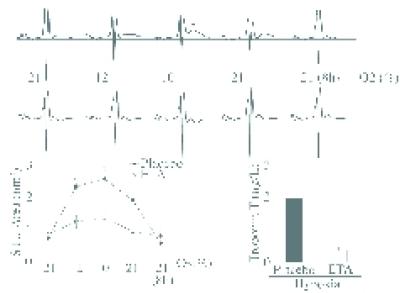
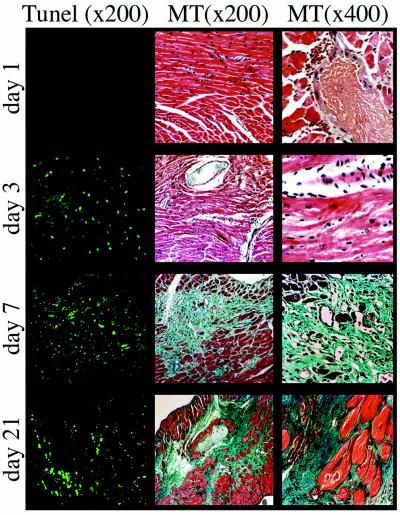
Myocardial infarction is linked to atherosclerosis, yet the sequence leading from silent coronary atherosclerosis to acute myocardial infarction has remained unclear. Here we show that hypercholesterolemic apolipoprotein E-/- low density lipoprotein receptor-/- mice develop not only coronary atherosclerosis but also myocardial infarction. Exposure of mice to mental stress or hypoxia led to acute ischemia, which, in a large proportion of the mice, was followed by electrocardiographic changes, leakage of troponin T, and loss of dehydrogenase from the myocardium, all indicative of acute myocardial infarction. Apoptotic death of cardiomyocytes was followed by inflammation and fibrosis in the heart. All these pathological changes could be prevented by a blocker of the endothelin type A receptor. Thus, stress elicits myocardial infarction through endothelin receptor signaling in coronary atherosclerosis caused by hypercholesterolemia.


Figures

Figure 1
Figure 1
Coronary atherosclerosis and myocardial postinfarction scars in hypercholesterolemic mice. (a and b) Coronary angiograms from a wild-type mouse (a) and a 7-month-old E0 × LDLR0 mouse (b). Red arrows indicate severe coronary stenosis, and black arrows indicate total occlusion. (ce) Histological analysis of coronary arteries from wild-type (c) and E0 × LDLR0 mice (d and e). Atherosclerotic plaques are evident in the latter. In e, a myocardial scar surrounds the occluded atherosclerotic artery. [Masson’s trichrome stain, original magnification = ×200 (c and d) and ×100 (e).]
Figure 2
Figure 2
Mental stress induces ECG changes and myocardial infarction in E0 × LDLR0 mice. ECG tracings (Left), serum troponin T levels (Center), and TTC staining for dehydrogenase activity in the myocardium (Right) are shown. Wild-type C57BL/6J (Top), a resting E0 × LDLR0 mouse (Middle), and an E0 × LDLR0 mouse exposed to the mental stress test (Bottom). ECG: STU segment deviations (arrows) are apparent in resting E0 × LDLR0 mice and exacerbated by stress. Troponin T concentrations are significantly elevated in E0 × LDLR0 mice exposed to mental stress. Concentrations >1 μg/liter are diagnostic for myocardial infarction in humans. Box-and-whisker plot is shown, in which the line in the box corresponds to the median and the top and bottom of the box correspond to the 75th and 25th percentile, respectively. The whiskers extend from the 10th to the 90th percentile. ∗, Significantly different from the other two groups (P < 0.05). TTC staining of heart segments is shown, where red staining indicates viable myocardium with dehydrogenase activity. There is a slight reduction in TTC staining in the myocardium of the resting E0 × LDLR0 mouse and a drastic loss of TTC dehydrogenase activity in the myocardium of the E0 × LDLR0 mouse exposed to mental stress.
Figure 3
Figure 3
Hypoxic stress induces ECG changes and myocardial infarction, which are prevented by the ETA blocker LU135252. (Top) ECG tracings during hypoxia in 7-month-old E0 × LDLR0 mouse. Arrow indicates STU segment elevation at 10% oxygen, which gradually returns to baseline during normoxia. Below are ECGs from the same mouse subjected to the same test 1 week later. This time, LU135252 was given i.p. 15 min before hypoxia. No STU elevation is seen. (Bottom Left) Average STU deviations during hypoxic stress in E0 × LDLR0 mice with LU135252 (ETA, n = 7) or placebo (n = 9). ∗, Significantly different from ETA group (P < 0.05). (Bottom Right) Serum troponin T elevations 1 week after hypoxic stress in E0 × LDLR0 mice were prevented by LU135252 (ETA). ∗, Significantly different from ETA group (P < 0.05).
Figure 4
Figure 4
Development of myocardial infarction after hypoxic stress in E0 × LDLR0 mice. (Left) Apoptotic cardiomyocytes (TUNEL stain, fluorescent microscopy). (Center and Right) Masson’s trichrome stain (MT). At day 1 after hypoxic stress, dead cardiomyocytes and a thrombosed coronary artery with extravasation of erythrocytes [MT (×400)] are evident. At day 3, scattered inflammatory cells are present between dead cardiomyocytes [TUNEL; MT (×400)]; atherosclerotic and collapsed intramural coronary arteries can be seen [MT (×200)]. At day 7, granulation tissue and collagen deposits are formed [blue, MT (×200)]; detail of the neovessels in the granulation tissue is shown at MT (×400). At day 21, dead cardiomyocyte fibers have been replaced by a dense collagenous scar (blue). A few remaining cardiac muscle cells are present (red).

References

    1. Murray C J, Lopez A D. Lancet. 1997;349:1436–1442. - PubMed
    1. Ross R. N Engl J Med. 1999;340:115–126. - PubMed
    1. Libby P. Circulation. 1995;91:2844–2850. - PubMed
    1. Breslow J L. Science. 1996;272:685–688. - PubMed
    1. Plump A S, Smith J D, Hayek T, Aalto-Setälä K, Walsh A, Verstuyft J G, Rubin E M, Breslow J L. Cell. 1992;71:343–353. - PubMed

Publication types

MeSH terms