. 1999 Jun;154(6):1911-21.
doi: 10.1016/S0002-9440(10)65449-1.

Shifts in lung lymphocyte profiles correlate with the sequential development of acute allergic and chronic tolerant stages in a murine asthma model

Affiliations

Shifts in lung lymphocyte profiles correlate with the sequential development of acute allergic and chronic tolerant stages in a murine asthma model

C A Yiamouyiannis et al. Am J Pathol. 1999 Jun.

Abstract

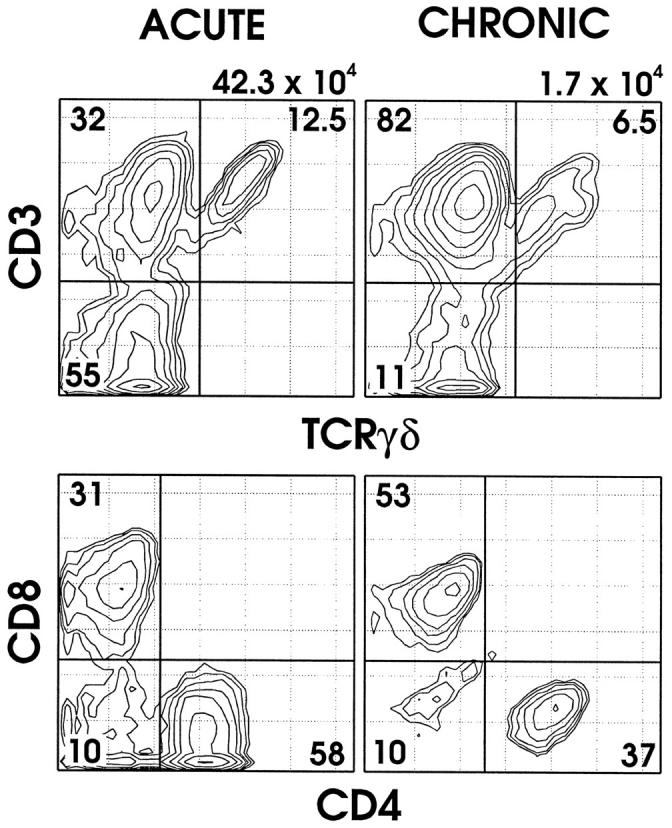
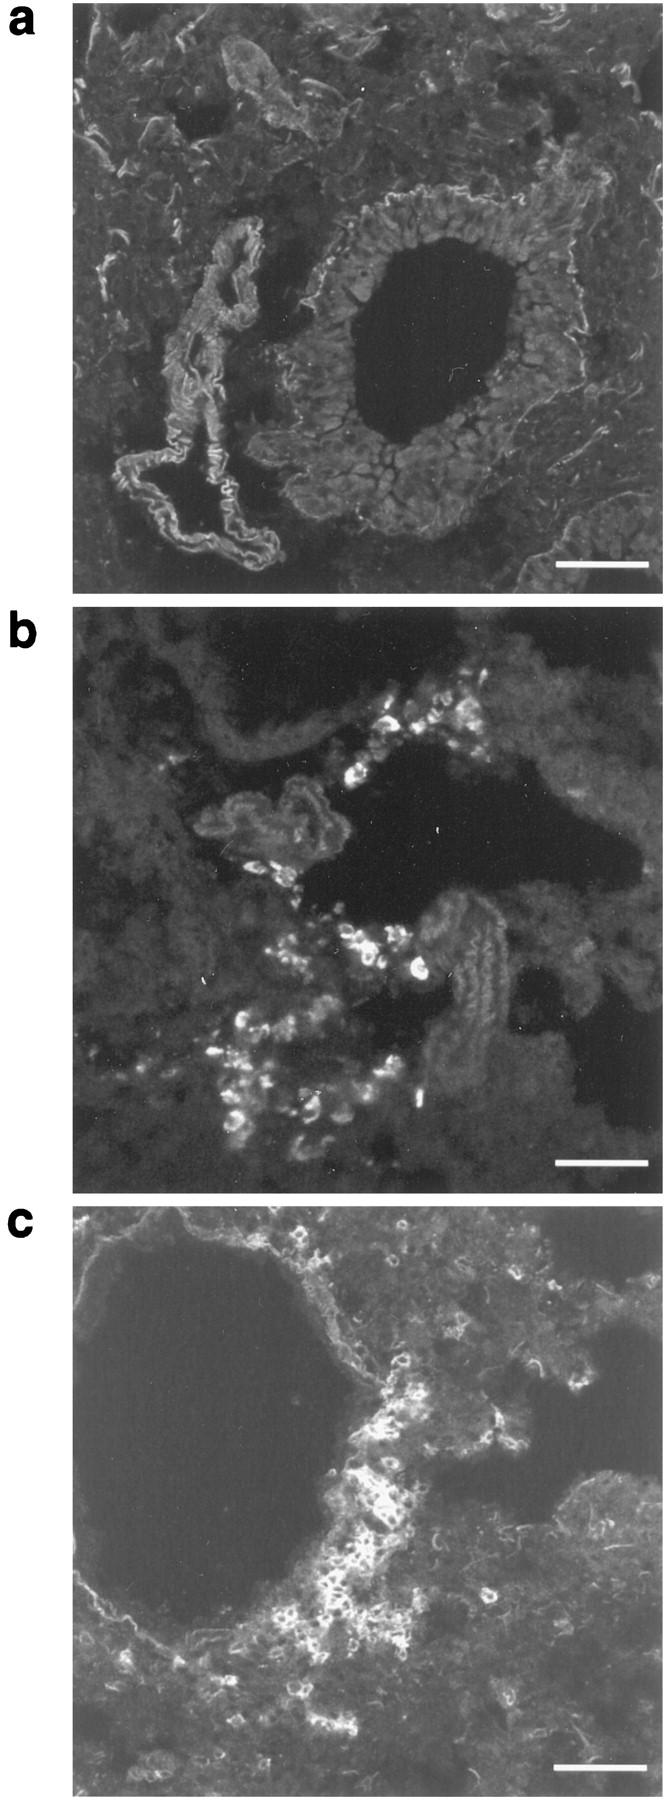
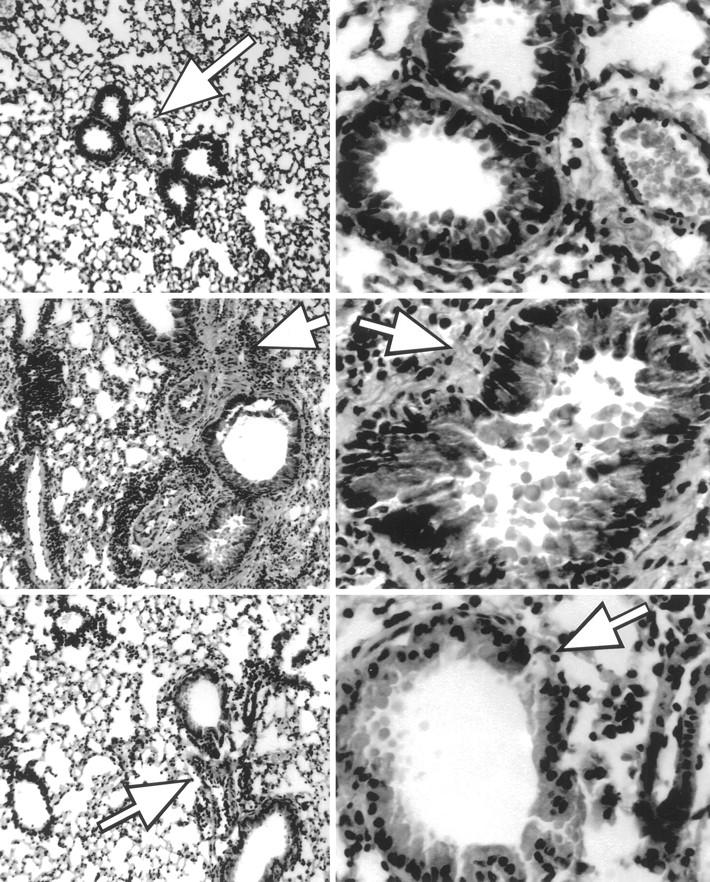
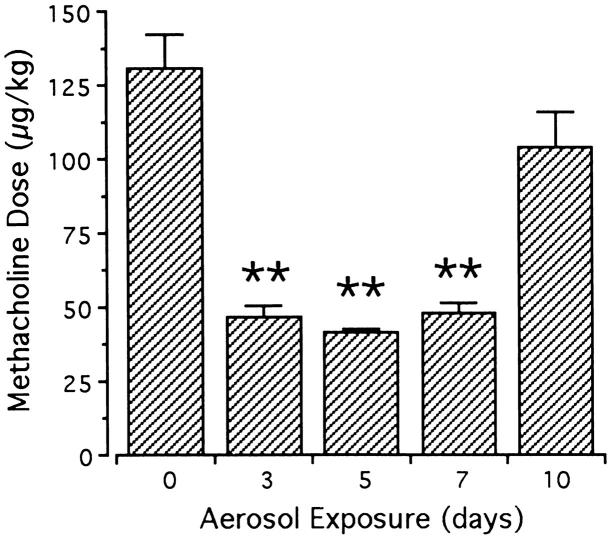
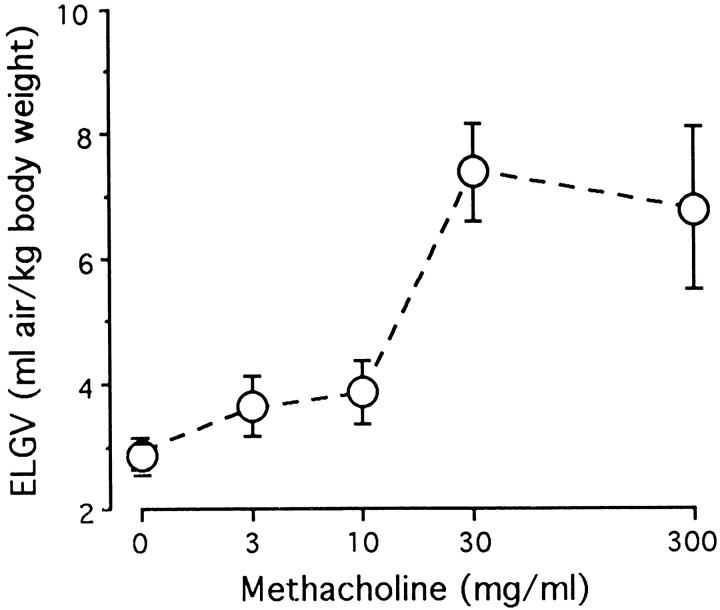
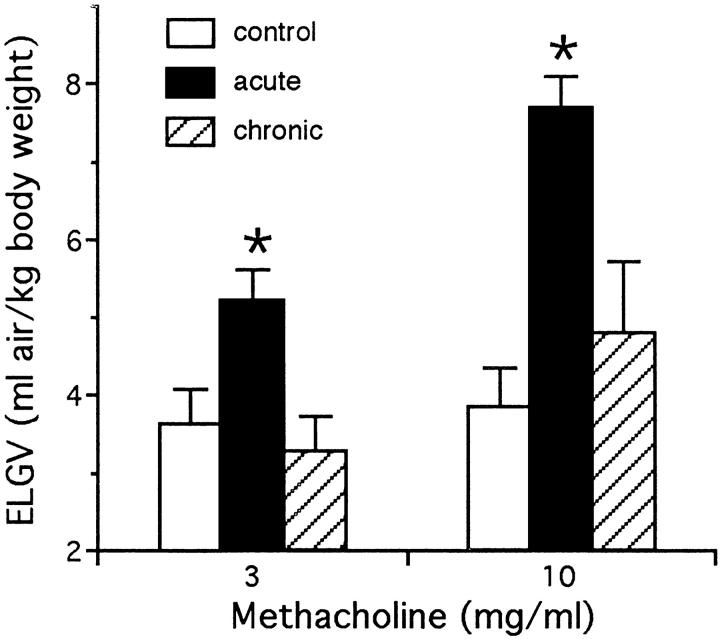
T lymphocytes have a central regulatory role in the pathogenesis of asthma. We delineated the participation of lymphocytes in the acute allergic and chronic tolerant stages of a murine model of asthma by characterizing the various subsets of lymphocytes in bronchoalveolar lavage and lung tissue associated with these responses. Acute (10-day) aerosol challenge of immunized C57BL/6J mice with ovalbumin resulted in airway eosinophilia, histological evidence of peribronchial and perivascular airway inflammation, clusters of B cells and TCRgammadelta cells in lung tissue, increased serum IgE levels, and airway hyperresponsiveness to methacholine. In mice subjected to chronic (6-week) aerosol challenge with ovalbumin, airway inflammation and serum IgE levels were significantly attenuated and airway hyperresponsiveness was absent. The marked increases in lung B and T cell populations seen in the acute stage were also significantly reduced in the chronic stage of this model. Thus, acute ovalbumin challenge resulted in airway sensitization characteristic of asthma, whereas chronic ovalbumin challenge elicited a suppressed or tolerant state. The transition from antigenic sensitization to tolerance was accompanied by shifts in lymphocyte profiles in the lung and bronchoalveolar lavage fluid.


Figures

Figure 1.
Figure 1.
Flow cytometric analysis of BAL T cells in representative 10-day acute (left column) and 6-week chronic (right column) ovalbumin (OVA) challenged mice. Top panels: BAL cells were stained with MAb directed against CD45, TCRβ, TCRδ, and CD3ɛ and analyzed by fluorescence flow cytometry. CD45+ lymphocytes were positively gated and analyzed for TCR expression. Cells in the lower left quadrant represent B cells as confirmed by B220 expression. Note the relative increase in TCRαβ cells and the decreases in TCRγδ cells and B cells in the chronic state. Lower panels: BAL cells were stained with MAb directed against CD45, TCRβ, CD4, and CD8 and analyzed by fluorescence flow cytometry. CD45+TCRβ+ lymphocytes were positively gated and analyzed for expression of CD4 or CD8. Note the change in distributions of TCRαβ CD8+ and CD4+ cells between acute- and chronic-stage animals. The numbers above each column represent the total number of BAL hematopoietic cells (CD45+) within the FSC versus SSC lymphocyte gate from each mouse; numbers within each quadrant represent the percentage of cells of the indicated phenotype.
Figure 2.
Figure 2.
Immunofluorescence analysis of TCRγδ cells and B cells in lung tissue from representative unexposed mice and 10-day acute OVA exposed mice. Frozen lung sections were stained to detect TCRγδ cells (GL3-PE) and B cells (Ra3-6B2-PE) as described in Materials and Methods. Unexposed mice showed no TCRγδ cells (a) or B cells (not shown). In contrast, acute OVA challenged mice demonstrated clusters of TCRγδ cells (b) and B cells (c) in areas of peribronchial inflammation. Scale bars, 50 μm.
Figure 3.
Figure 3.
Lung histology from unexposed, 10-day acute OVA challenged, and 6-week chronic OVA challenged mice. Top panels: No evidence of histological damage was found in control unexposed animals or animals that received only the i.p. immunization protocol or the 10-consecutive-day inhalation protocol alone. Middle panels: The 10-day acute stage was characterized by dense peribronchial mixed inflammation consisting primarily of lymphoplasmacytic cells and eosinophils. Peribronchial muscle hypertrophy was also noted. Lower panels: The chronic-stage animals had mild to moderate peribronchial lymphoplasmacytic inflammation, mild peribronchial muscle hypertrophy, and slight to mild bronchial lining cell hyperplasia. Left panels are ×100 exposure; arrows demonstrate peribronchial areas. Right panels are ×400 exposures; arrows illustrate varied thickness of peribronchial smooth muscle between acute- and chronic-stage specimens.
Figure 4.
Figure 4.
Lung resistance (RL) dose-response relationships in response to intravenous methacholine in naive, 7-day and 10-day OVA challenged mice. Anesthetized, mechanically ventilated mice received serially increasing concentrations of intravenous methacholine, and RL responses were recorded as described in the text. Methacholine elicited dose-dependent increases in RL in all mice. The response was significantly potentiated in 7-day OVA challenged mice (▵) and 10-day OVA challenged mice (□) relative to naive control mice (○). Data represent mean ± SEM values, with four to seven mice in each group.
Figure 5.
Figure 5.
Sensitivity to intravenous methacholine in control and acute OVA challenged mice. Pulmonary sensitivity to methacholine was defined as the concentration eliciting an RL response 270% of baseline. Relative to the response in control animals (day 0), sensitivity significantly increased (lower provocative dose) in mice exposed to OVA aerosols for 3, 5, and 7 days. Sensitivity returned to control levels with 10 days of OVA aerosol challenge. Data represent mean + SEM values of three to seven animals/group; **significantly different response from day 0 (P < 0.01).
Figure 6.
Figure 6.
Dose-response curve of excised gas lung volume (ELGV) in response to aerosolized methacholine in control (unexposed to ovalbumin) mice. Mice inhaled a single concentration of methacholine, and measurements of retained air were made on their excised lungs. Methacholine elicited dose-dependent air trapping in control mice, with significantly increased ELGV values at 30 and 300 mg/ml (P < 0.01). ELGV is expressed in terms of mg of air/kg of body weight; data represent mean ± SEM values, with three to six mice in each group.
Figure 7.
Figure 7.
Excised gas lung volume (ELGV) in response to aerosolized methacholine in control, acute (10-day), and chronic (6-week) OVA challenged mice. Acute OVA mice (solid bars) had significantly increased ELGV values to 3 and 10 mg/ml methacholine, whereas chronic OVA mice (striped bars) were not different from control animals. Data represent mean + SEM values of three to five animals/group; *significantly different response (P < 0.05).
Figure 8.
Figure 8.
Serum IgE concentrations in OVA immunized and challenged mice. Serum IgE was measured using a capture ELISA, as described in Materials and Methods. When compared with either unexposed (<400 ng/ml) or day 1 of aerosol ovalbumin exposure, significant increases in IgE levels were noted at days 5, 7, and 10 of acute exposure (**P ≤ 0.005; *P ≤ 0.05). Total serum IgE in mice subjected to chronic aerosol exposure (35 days) was not significantly different from mice exposed to OVA for 1 day. Data represent mean + SEM values for five to seven mice in each group.

Similar articles

Cited by

References

    1. Holt PG: Immunoregulation of the allergic reaction in the respiratory tract. Eur Respir J 1996, 9(Suppl 22):85s-89s - PubMed
    1. Coffman RL, Carty J: A T cell activity that enhances polyclonal IgE production and its inhibition by interferon-γ. J Immunol 1986, 136:949-954 - PubMed
    1. Vercelli D, Geha RS: Regulation of IgE synthesis in humans. J Clin Immunol 1989, 9:75-83 - PubMed
    1. Kay AB: “Helper” (CD4+) T cells and eosinophils in allergy and asthma. Am Rev Respir Dis 1992, 145:S22-S26 - PubMed
    1. Defrance T, Carayon P, Billian G, Guillemot JC, Minty A, Caput D, Ferrara P: Interleukin 13 is a B cell stimulating factor. J Exp Med 1994, 179:135-143 - PMC - PubMed

Publication types

MeSH terms