

doi: 10.1101/gad.13.11.1355.
p53-mediated apoptosis is attenuated in Werner syndrome cells
Affiliations
- PMID: 10364153
- PMCID: PMC316776
- DOI: 10.1101/gad.13.11.1355
Item in Clipboard
p53-mediated apoptosis is attenuated in Werner syndrome cells
Genes Dev.
.
Abstract
The WRN DNA helicase is a member of the DExH-containing DNA helicase superfamily that includes XPB, XPD, and BLM. Mutations in WRN are found in patients with the premature aging and cancer susceptibility syndrome known as Werner syndrome (WS). p53 binds to the WRN protein in vivo and in vitro through its carboxyl terminus. WS fibroblasts have an attenuated p53- mediated apoptotic response, and this deficiency can be rescued by expression of wild-type WRN. These data support the hypothesis that p53 can induce apoptosis through the modulation of specific DExH-containing DNA helicases and may have implications for the cancer predisposition observed in WS patients.
Figures
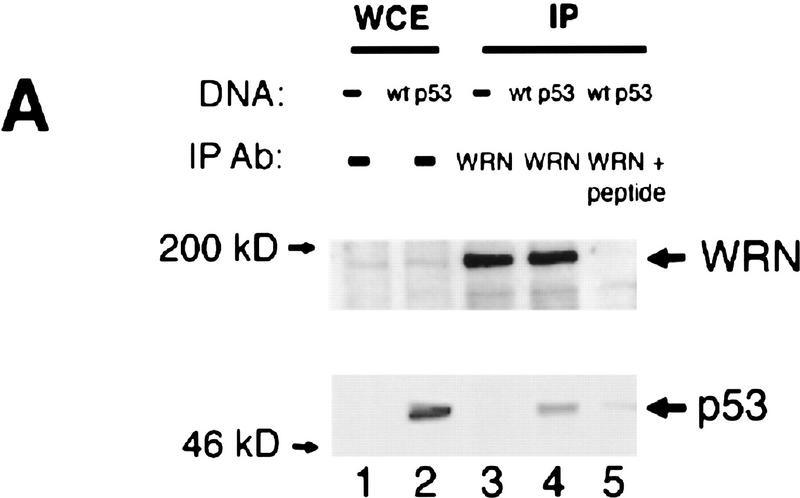
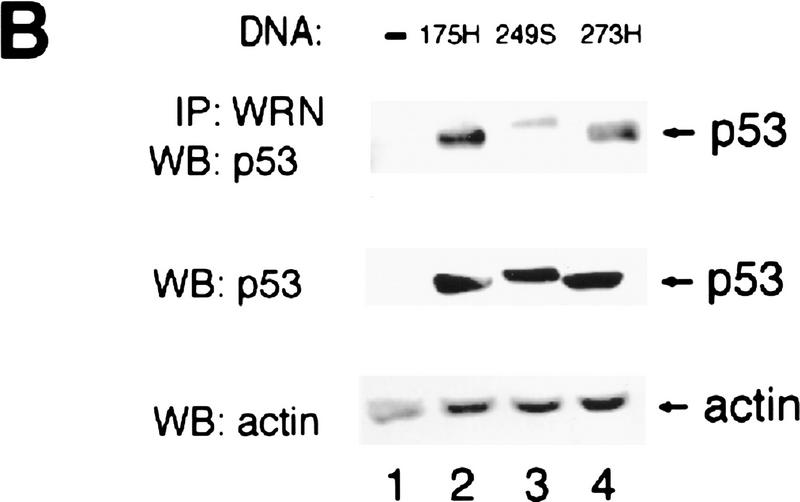
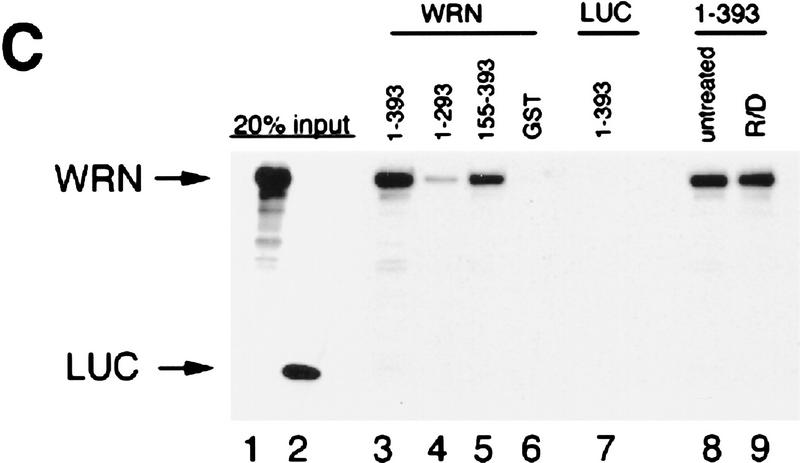
p53 and WRN bind both in vitro and in vivo. (A) Calu-6 cells (p53 null) were infected with wild-type p53 adenovirus (lanes 2,4,5). Uninfected cells were used as negative controls (lanes 1,3). Protein lysates were immunoprecipitated with either anti-WRN (lanes 3,4) or a peptide-blocked anti-WRN antibody (lane 5). Whole cell extract (WCE) (50 μg) was loaded (lanes 1,2) as controls. (Top) The WRN protein migrating slightly larger than the 200 kD protein marker; (bottom) the p53 protein. (B) Calu-6 cells were transfected with amino acid 175H (lane 2), 249S (lane 3), or 273H (lane 4) mutant p53 expression vectors. Untransfected cells were used as negative controls (lane 1). (Top) Mutant p53 proteins comigrating from lysates immunoprecipitated with anti-WRN antibody. WCEs (20 μg) were loaded straight onto the gel and probed for either p53 (middle) or actin (bottom) to illustrate equal expression and loading of the proteins. (C) GST–p53 fusion proteins were incubated with in vitro-translated WRN protein (lanes 3–5) or luciferase (lane 7) to determine the binding specificity of p53 and WRN proteins. Full-length p53 (lane 3), carboxyl terminus (lane 4), or amino terminus deletion (lane 5) mutants show binding to the WRN protein. GST alone (lane 6) does not bind to WRN. Full-length p53 does not bind to luciferase (LUC) (lane 7). Treatment with R/D (RNase/DNase) (lanes 8,9) does not affect the binding. (Lanes 1,2) A 20% input of the WRN and luciferase proteins, respectively.
p53 and WRN bind both in vitro and in vivo. (A) Calu-6 cells (p53 null) were infected with wild-type p53 adenovirus (lanes 2,4,5). Uninfected cells were used as negative controls (lanes 1,3). Protein lysates were immunoprecipitated with either anti-WRN (lanes 3,4) or a peptide-blocked anti-WRN antibody (lane 5). Whole cell extract (WCE) (50 μg) was loaded (lanes 1,2) as controls. (Top) The WRN protein migrating slightly larger than the 200 kD protein marker; (bottom) the p53 protein. (B) Calu-6 cells were transfected with amino acid 175H (lane 2), 249S (lane 3), or 273H (lane 4) mutant p53 expression vectors. Untransfected cells were used as negative controls (lane 1). (Top) Mutant p53 proteins comigrating from lysates immunoprecipitated with anti-WRN antibody. WCEs (20 μg) were loaded straight onto the gel and probed for either p53 (middle) or actin (bottom) to illustrate equal expression and loading of the proteins. (C) GST–p53 fusion proteins were incubated with in vitro-translated WRN protein (lanes 3–5) or luciferase (lane 7) to determine the binding specificity of p53 and WRN proteins. Full-length p53 (lane 3), carboxyl terminus (lane 4), or amino terminus deletion (lane 5) mutants show binding to the WRN protein. GST alone (lane 6) does not bind to WRN. Full-length p53 does not bind to luciferase (LUC) (lane 7). Treatment with R/D (RNase/DNase) (lanes 8,9) does not affect the binding. (Lanes 1,2) A 20% input of the WRN and luciferase proteins, respectively.
p53 and WRN bind both in vitro and in vivo. (A) Calu-6 cells (p53 null) were infected with wild-type p53 adenovirus (lanes 2,4,5). Uninfected cells were used as negative controls (lanes 1,3). Protein lysates were immunoprecipitated with either anti-WRN (lanes 3,4) or a peptide-blocked anti-WRN antibody (lane 5). Whole cell extract (WCE) (50 μg) was loaded (lanes 1,2) as controls. (Top) The WRN protein migrating slightly larger than the 200 kD protein marker; (bottom) the p53 protein. (B) Calu-6 cells were transfected with amino acid 175H (lane 2), 249S (lane 3), or 273H (lane 4) mutant p53 expression vectors. Untransfected cells were used as negative controls (lane 1). (Top) Mutant p53 proteins comigrating from lysates immunoprecipitated with anti-WRN antibody. WCEs (20 μg) were loaded straight onto the gel and probed for either p53 (middle) or actin (bottom) to illustrate equal expression and loading of the proteins. (C) GST–p53 fusion proteins were incubated with in vitro-translated WRN protein (lanes 3–5) or luciferase (lane 7) to determine the binding specificity of p53 and WRN proteins. Full-length p53 (lane 3), carboxyl terminus (lane 4), or amino terminus deletion (lane 5) mutants show binding to the WRN protein. GST alone (lane 6) does not bind to WRN. Full-length p53 does not bind to luciferase (LUC) (lane 7). Treatment with R/D (RNase/DNase) (lanes 8,9) does not affect the binding. (Lanes 1,2) A 20% input of the WRN and luciferase proteins, respectively.
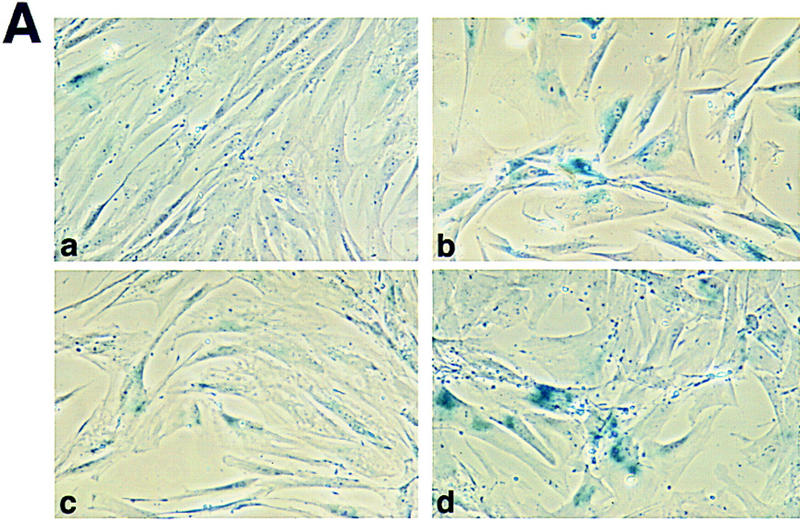
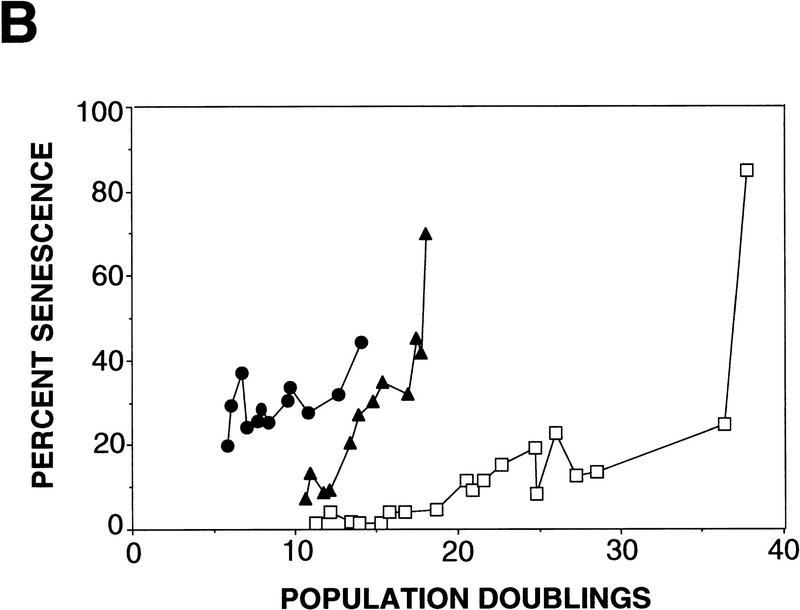
Rapid senescence of WS fibroblasts. (A) For each microinjection experiment, cells were fixed and stained for SA β-gal activity for 12–18 hr. Positively stained cells for GM08402 normal fibroblasts at an early PD of 6.2 (A) and a late PD of 24.4 (B) are shown (a,b). AG12797 fibroblasts at an early PD of 6.7 (C) and late PD of 14 (D) are shown (c,d). (B) PDs were determined as described. The percent of senescent cells for normal fibroblasts GM08402 (□), and WS fibroblasts AG03141 (▴) and AG12797 (●) was plotted against the PDs.
Rapid senescence of WS fibroblasts. (A) For each microinjection experiment, cells were fixed and stained for SA β-gal activity for 12–18 hr. Positively stained cells for GM08402 normal fibroblasts at an early PD of 6.2 (A) and a late PD of 24.4 (B) are shown (a,b). AG12797 fibroblasts at an early PD of 6.7 (C) and late PD of 14 (D) are shown (c,d). (B) PDs were determined as described. The percent of senescent cells for normal fibroblasts GM08402 (□), and WS fibroblasts AG03141 (▴) and AG12797 (●) was plotted against the PDs.
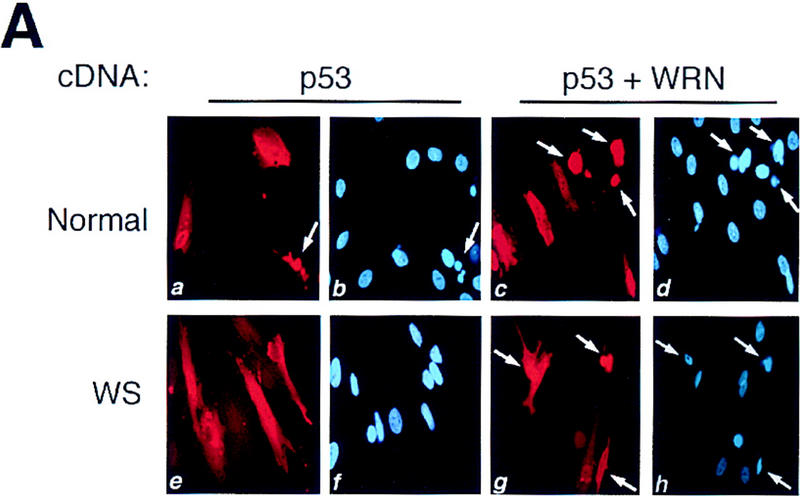
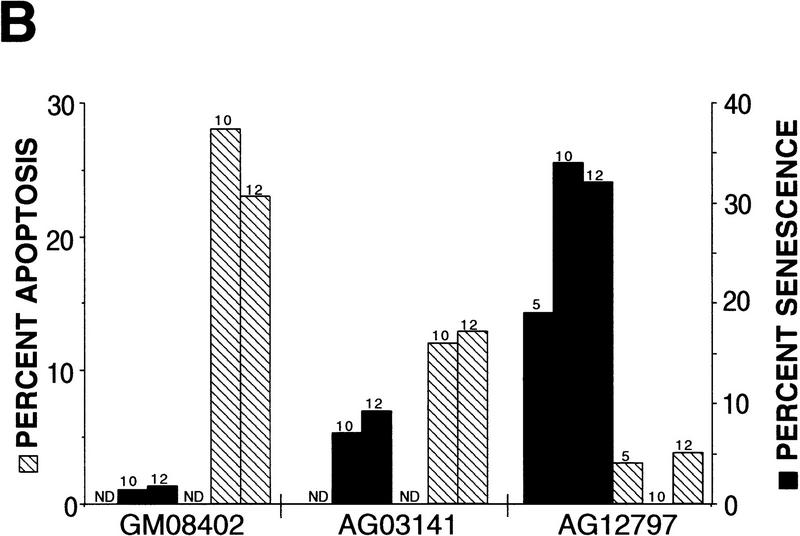
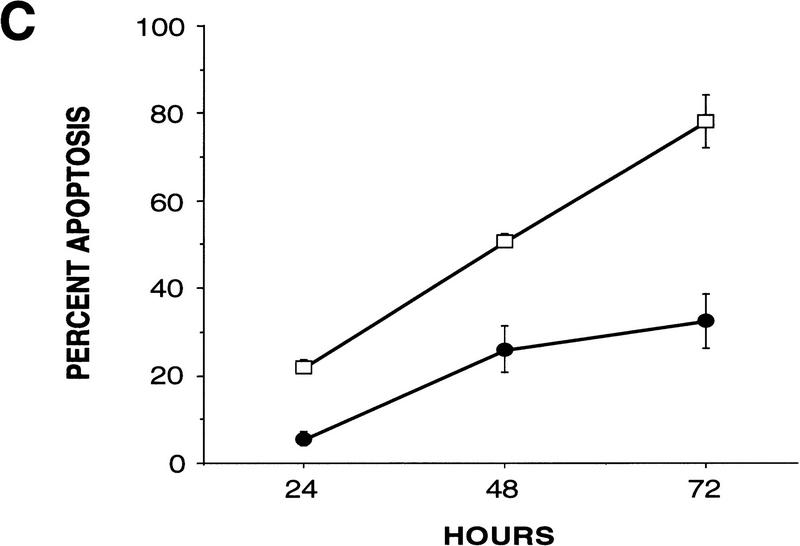
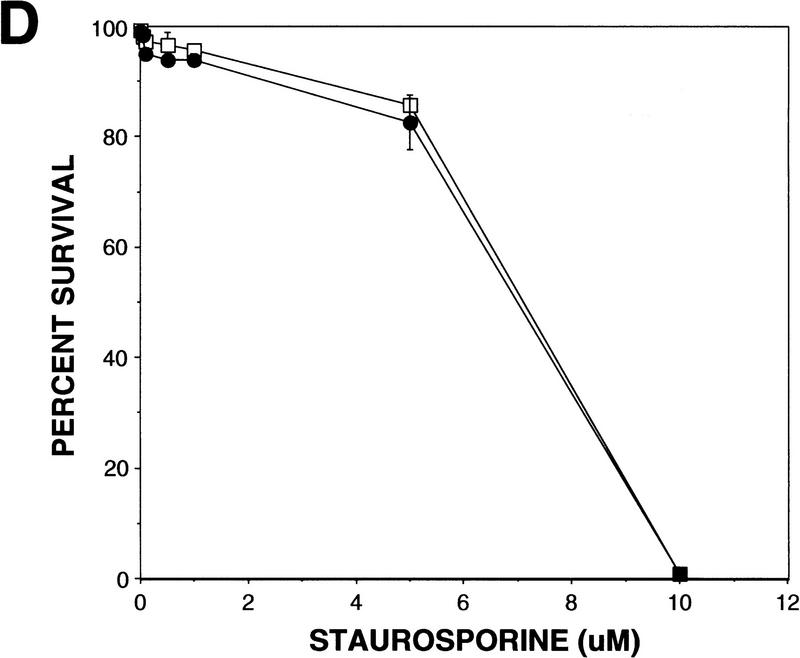
p53-mediated apoptosis in normal and WS fibroblasts. (A) Both normal (a,b) and WS fibroblasts, AG00780 (e,f), were microinjected with 200 ng/μl wild-type p53 expression vector. Cells were fixed 24 hr postmicroinjection and stained for p53 (a,e); nuclei were stained with DAPI (b,f). Both GM08402 (c,d) and WS (AG00780) (g,h) fibroblasts were then microinjected with 100 ng/μl wild-type p53 plus 100 ng/μl WRN. Cells were fixed at 24 hr and stained for p53 (c,g); nuclei were stained with DAPI (d,h). (B) The percent apoptosis vs. percent senescence were determined for specific PDs. PDs of 5, 10, and 12 are shown and indicated at top of bars. Data presented were compiled from microinjection experiments (see Fig. 3A). (Hatched bars) Percent apoptosis; (solid bars) percent senescence. Results for normal (GM08402) and WS (AG03141, AG12797) fibroblasts are shown. (C) Normal (GM08402, □) and WS fibroblasts (AG12797, ●) were microinjected with the wild-type p53 expression vector. Cells were fixed and stained for p53 protein, and the nuclei stained with DAPI at 24, 48, and 72 hr. The number of apoptotic cells was calculated for each time point and results are graphed. (D) Normal (GM08402, □) and WS (AG00780, ●) fibroblasts were treated with staurosporine for 24 hr. Cells were stained as described in Materials and Methods. The percentage of dead cells was calculated as the number of Annexin V-positive cells/total number of cells. Three independent experiments were performed in C and D.
p53-mediated apoptosis in normal and WS fibroblasts. (A) Both normal (a,b) and WS fibroblasts, AG00780 (e,f), were microinjected with 200 ng/μl wild-type p53 expression vector. Cells were fixed 24 hr postmicroinjection and stained for p53 (a,e); nuclei were stained with DAPI (b,f). Both GM08402 (c,d) and WS (AG00780) (g,h) fibroblasts were then microinjected with 100 ng/μl wild-type p53 plus 100 ng/μl WRN. Cells were fixed at 24 hr and stained for p53 (c,g); nuclei were stained with DAPI (d,h). (B) The percent apoptosis vs. percent senescence were determined for specific PDs. PDs of 5, 10, and 12 are shown and indicated at top of bars. Data presented were compiled from microinjection experiments (see Fig. 3A). (Hatched bars) Percent apoptosis; (solid bars) percent senescence. Results for normal (GM08402) and WS (AG03141, AG12797) fibroblasts are shown. (C) Normal (GM08402, □) and WS fibroblasts (AG12797, ●) were microinjected with the wild-type p53 expression vector. Cells were fixed and stained for p53 protein, and the nuclei stained with DAPI at 24, 48, and 72 hr. The number of apoptotic cells was calculated for each time point and results are graphed. (D) Normal (GM08402, □) and WS (AG00780, ●) fibroblasts were treated with staurosporine for 24 hr. Cells were stained as described in Materials and Methods. The percentage of dead cells was calculated as the number of Annexin V-positive cells/total number of cells. Three independent experiments were performed in C and D.
p53-mediated apoptosis in normal and WS fibroblasts. (A) Both normal (a,b) and WS fibroblasts, AG00780 (e,f), were microinjected with 200 ng/μl wild-type p53 expression vector. Cells were fixed 24 hr postmicroinjection and stained for p53 (a,e); nuclei were stained with DAPI (b,f). Both GM08402 (c,d) and WS (AG00780) (g,h) fibroblasts were then microinjected with 100 ng/μl wild-type p53 plus 100 ng/μl WRN. Cells were fixed at 24 hr and stained for p53 (c,g); nuclei were stained with DAPI (d,h). (B) The percent apoptosis vs. percent senescence were determined for specific PDs. PDs of 5, 10, and 12 are shown and indicated at top of bars. Data presented were compiled from microinjection experiments (see Fig. 3A). (Hatched bars) Percent apoptosis; (solid bars) percent senescence. Results for normal (GM08402) and WS (AG03141, AG12797) fibroblasts are shown. (C) Normal (GM08402, □) and WS fibroblasts (AG12797, ●) were microinjected with the wild-type p53 expression vector. Cells were fixed and stained for p53 protein, and the nuclei stained with DAPI at 24, 48, and 72 hr. The number of apoptotic cells was calculated for each time point and results are graphed. (D) Normal (GM08402, □) and WS (AG00780, ●) fibroblasts were treated with staurosporine for 24 hr. Cells were stained as described in Materials and Methods. The percentage of dead cells was calculated as the number of Annexin V-positive cells/total number of cells. Three independent experiments were performed in C and D.
p53-mediated apoptosis in normal and WS fibroblasts. (A) Both normal (a,b) and WS fibroblasts, AG00780 (e,f), were microinjected with 200 ng/μl wild-type p53 expression vector. Cells were fixed 24 hr postmicroinjection and stained for p53 (a,e); nuclei were stained with DAPI (b,f). Both GM08402 (c,d) and WS (AG00780) (g,h) fibroblasts were then microinjected with 100 ng/μl wild-type p53 plus 100 ng/μl WRN. Cells were fixed at 24 hr and stained for p53 (c,g); nuclei were stained with DAPI (d,h). (B) The percent apoptosis vs. percent senescence were determined for specific PDs. PDs of 5, 10, and 12 are shown and indicated at top of bars. Data presented were compiled from microinjection experiments (see Fig. 3A). (Hatched bars) Percent apoptosis; (solid bars) percent senescence. Results for normal (GM08402) and WS (AG03141, AG12797) fibroblasts are shown. (C) Normal (GM08402, □) and WS fibroblasts (AG12797, ●) were microinjected with the wild-type p53 expression vector. Cells were fixed and stained for p53 protein, and the nuclei stained with DAPI at 24, 48, and 72 hr. The number of apoptotic cells was calculated for each time point and results are graphed. (D) Normal (GM08402, □) and WS (AG00780, ●) fibroblasts were treated with staurosporine for 24 hr. Cells were stained as described in Materials and Methods. The percentage of dead cells was calculated as the number of Annexin V-positive cells/total number of cells. Three independent experiments were performed in C and D.
References
-
- Clarke AR, Purdie CA, Harrison DJ, Morris RG, Bird CC, Hooper ML, Wyllie AH. Thymocyte apoptosis induced by p53-dependent and independent pathways. Nature. 1993;362:849–852. - PubMed
-
- Ellis NA. DNA helicases in inherited human disorders. Curr Opin Genet Dev. 1997;7:354–363. - PubMed
-
- Epstein CJ, Martin GM, Schultz AL, Motulsky AG. Werner’s syndrome: A review of its symptomatology, natural history, pathologic features, genetics and relationship to the natural aging process. Medicine (Baltim). 1966;45:177–221. - PubMed
Publication types
MeSH terms
Substances
Grants and funding
LinkOut - more resources
Full Text Sources
Research Materials
Miscellaneous