. 1999 Jul;73(7):5438-47.
doi: 10.1128/JVI.73.7.5438-5447.1999.

Isolation of recombinant adeno-associated virus vector-cellular DNA junctions from mouse liver

Affiliations

Isolation of recombinant adeno-associated virus vector-cellular DNA junctions from mouse liver

H Nakai et al. J Virol. 1999 Jul.

Abstract

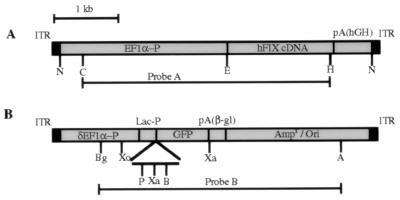
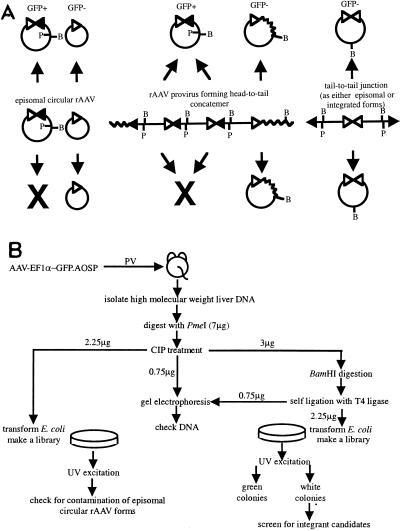
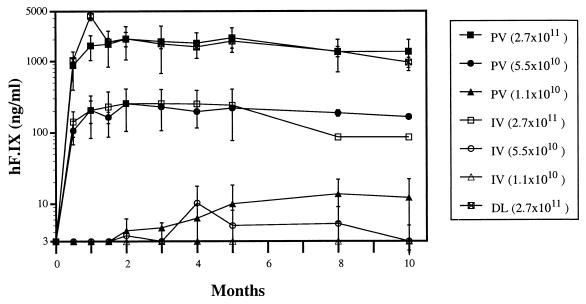
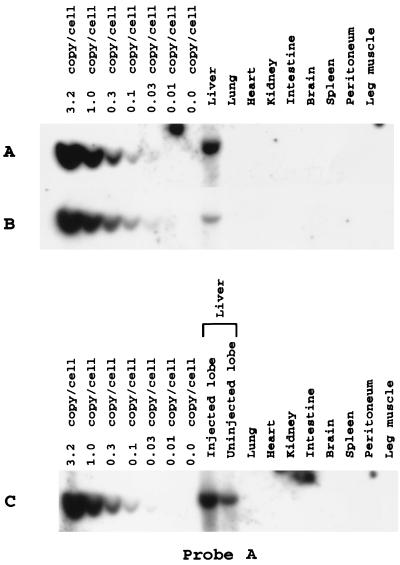
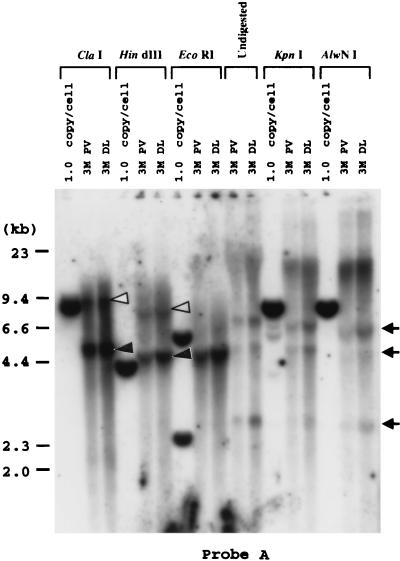
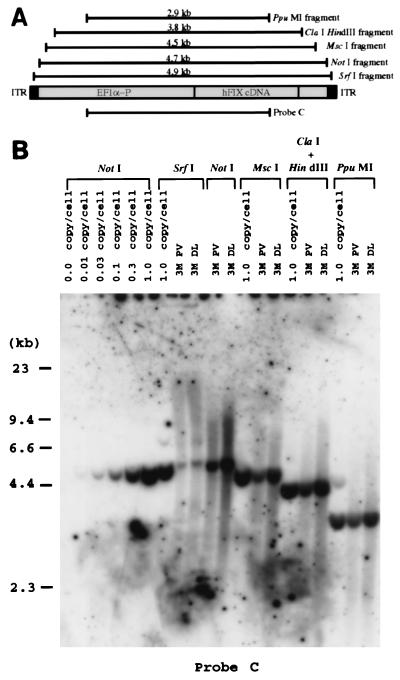
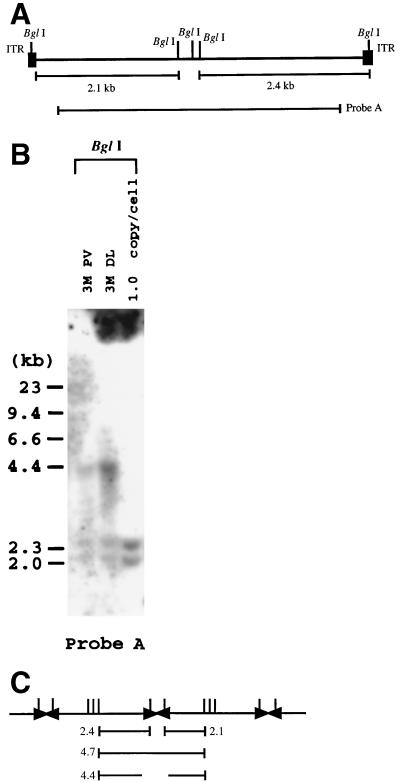
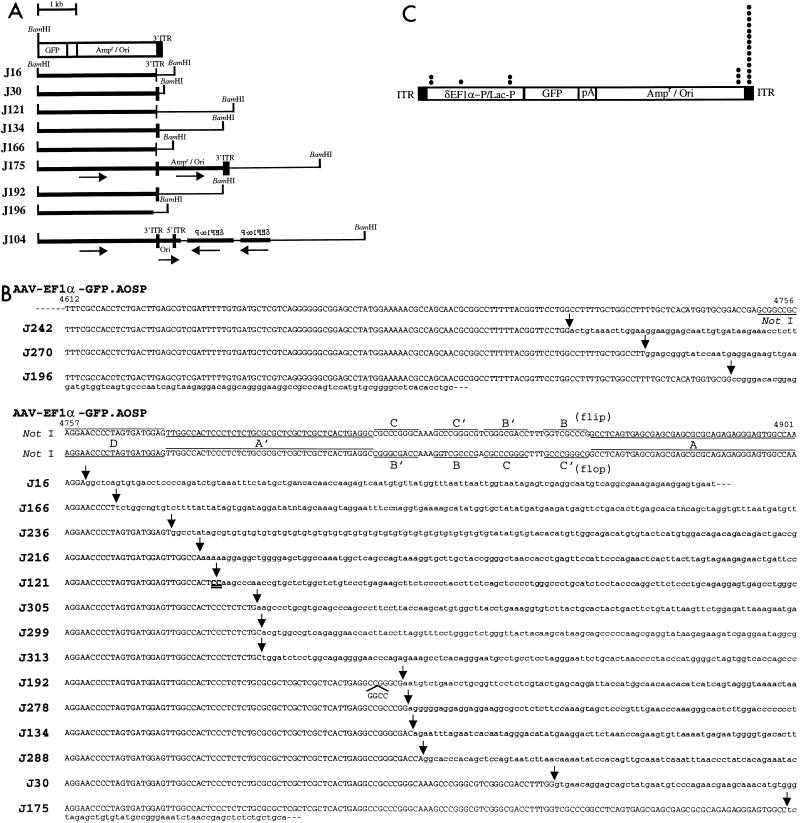
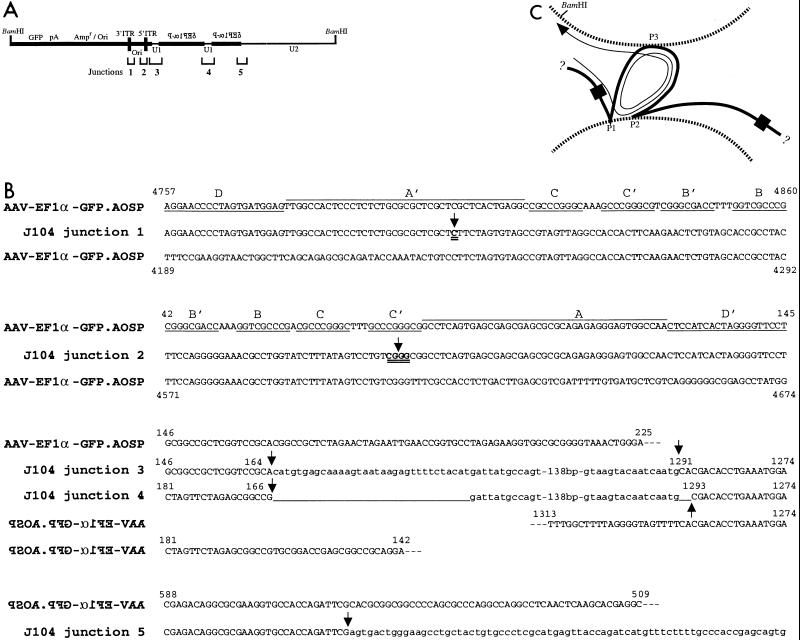
Recombinant adeno-associated virus (rAAV) vectors allow for sustained expression of transgene products from mouse liver following a single portal vein administration. Here a rAAV vector expressing human coagulation factor F.IX (hF.IX), AAV-EF1alpha-F.IX (hF.IX expression was controlled by the human elongation factor 1alpha [EF1alpha] enhancer-promoter) was injected into mice via the portal vein or tail vein, or directly into the liver parenchyma, and the forms of rAAV vector DNA extracted from the liver were analyzed. Southern blot analyses suggested that rAAV vector integrated into the host genome, forming mainly head-to-tail concatemers with occasional deletions of the inverted terminal repeats (ITRs) and their flanking sequences. To further confirm vector integration, we developed a shuttle vector system and isolated and sequenced rAAV vector-cellular DNA junctions from transduced mouse livers. Analysis of 18 junctions revealed various rearrangements, including ITR deletions and amplifications of the vector and cellular DNA sequences. The breakpoints of the vector were mostly located within the ITRs, and cellular DNA sequences were recombined with the vector genome in a nonhomologous manner. Two rAAV-targeted DNA sequences were identified as the mouse rRNA gene and the alpha1 collagen gene. These observations serve as direct evidence of rAAV integration into the host genome of mouse liver and allow us to begin to elucidate the mechanisms involved in rAAV integration into tissues in vivo.


Figures

FIG. 1
FIG. 1
Map of rAAV vectors. (A) AAV-EF1α-F.IX; (B) AAV-EF1α-GFP.AOSP. The locations of restriction enzymes and probes are depicted. EF1α-P, the human polypeptide elongation factor 1α gene enhancer-promoter; hF.IX cDNA, human coagulation factor IX cDNA; pA(hGH), the human growth hormone gene polyadenylation signal; δEF1α-P, truncated EF1α-P; Lac-P, bacterial lac operon promoter; GFP, the enhanced green fluorescent protein gene; pA(β-gl), the human β-globin gene polyadenylation signal; Ampr, the bacterial ampicillin resistance gene; Ori, plasmid origin of replication; A, AlwNI; B, BamHI; Bg, BglII; C, ClaI; E, EcoRI; H, HindIII; N, NotI; P, PmeI; Xa, XbaI; Xo, XhoI.
FIG. 2
FIG. 2
(A) Schematic structure of possible forms of rAAV in tissue (center row), plasmids possibly rescuable by BamHI digestion and religation (top row), and plasmids possibly rescuable by BamHI digestion and religation following PmeI digestion and CIP treatment (bottom row). Examples of possible forms in tissue are episomal circular rAAV forms (monomers circularized at the ITRs and aberrant rAAV monomers lacking both BamHI and PmeI sites), rAAV provirus with three tandem repeats forming a head-to-tail concatemer, and a tail-to-tail junction from either episomal or integrated rAAV forms. PmeI digestion can remove GFP+ episomal forms and head-to-tail circular molecules derived from inner repeats of rAAV concatemers. B, BamHI; P, PmeI site. The straight and zigzag lines represent rAAV vector and mouse genomic DNA sequences, respectively. (B) Construction of a rAAV vector-cellular DNA junction fragment library from mouse liver DNA transduced with AAV-EF1α-GFP.AOSP. High-molecular-weight DNA was isolated from transduced liver. Seven micrograms of liver DNA was digested with PmeI and treated with CIP. DNA (2.25 μg) was directly used to transform E. coli to assess contamination of episomal circular forms of rAAV insensitive to PmeI digestion, and 0.75 μg of DNA was analyzed by gel electrophoresis. Three micrograms of the above-mentioned DNA was digested with BamHI and self-ligated with T4 DNA ligase. A junction fragment library was made by transforming E. coli with 2.25 μg of the above-mentioned DNA, and the remaining 0.75 μg was electrophoresed to analyze the DNA. Colonies were classified as GFP+ (green) and GFP (white) by UV excitation. The white colonies were subjected to the screening procedure for identification of integrant candidates.
FIG. 3
FIG. 3
Levels of hF.IX in plasma of C57BL/6 mice following administration of three doses (2.7 × 10¹¹, 5.5 × 10¹⁰, and 1.1 × 10¹⁰ particles/animal) of AAV-EF1α-F.IX via PV or i.v. injection and a dose (2.7 × 10¹¹ particles/animal) of the same vector via DL injection. Plasma samples were collected over time and assayed for hF.IX (n = 4 in each group). A single mouse in each group injected via the PV (2.7 × 10¹¹), i.v. (2.7 × 10¹¹), and DL (2.7 × 10¹¹) routes was sacrificed 3 months postinjection. The hF.IX levels at the 8- and 10-month time points (IV) (2.7 × 10¹¹) represent the results from a single mouse.
FIG. 4
FIG. 4
Southern blot analysis to determine vector copy numbers in tissues from mice injected with 2.7 × 10¹¹ particles of AAV-EF1α-F.IX via three different routes: PV (A), i.v. (B), and DL (C). The mice were sacrificed 3 months postinjection, and tissues (left lateral lobe of the liver, uninjected liver in the case of DL, lung, heart, kidney, intestine, brain, spleen, peritoneum, and leg muscle) were analyzed. Twenty micrograms of total DNA extracted from each tissue was digested with ClaI and HindIII, electrophoresed, and hybridized with probe A. Vector copy number standards were 20 μg of naive mouse liver DNA spiked with an equivalent number of the vector plasmid molecules and described as copies/cell (the number of double-stranded rAAV genomes per diploid genomic equivalent).
FIG. 5
FIG. 5
Southern blot analysis to determine rAAV vector forms in the livers from C57BL/6 mice injected with a dose of 2.7 × 10¹¹ particles of AAV-EF1α-F.IX via PV or DL route. The time of sacrifice, the route of vector administration, and the enzymes used are shown above each lane. Twenty micrograms of total DNA was digested with selected restriction enzymes, electrophoresed on a 0.8% agarose gel along with vector copy number standards, transferred to a nylon membrane (Duralon UV; Stratagene), and hybridized with 32P-labeled probe A. The membrane was washed and exposed to film at −80°C for 1 to 3 weeks. Copy number standards (the number of double-stranded rAAV genomes per diploid genomic equivalent) were prepared by spiking an equivalent number of the vector plasmid molecules into 20 μg of total DNA extracted from naive mouse liver. The predicted fragment lengths of concatemeric rAAV forms with intact ITRs are (i) 5.0 kb of ClaI, HindIII, or EcoRI digests for head-to-tail forms; (ii) 8.5 and 5.2 kb of HindIII and EcoRI digests, respectively, for head-to-head forms; and (iii) 9.0 and 4.7 kb of ClaI and EcoRI digest, respectively, for tail-to-tail forms. The fragment lengths of copy number standards are 8.1 (ClaI), 4.3 (HindIII), 5.4 and 2.4 (EcoRI), 8.1 (KpnI), and 8.1 (AlwNI) kb. KpnI and AlwNI do not cut the vector genome. The solid arrowheads indicate head-to-tail forms, while the open arrowheads show head-to-head or tail-to-tail forms. The bands indicated by arrows were presumed to represent double-stranded linear-monomer rAAV vector forms, because the same pattern was observed from the DNA extracted from rAAV stocks, in which only a linear-monomer form was observed by alkaline gel electrophoresis (data not shown). The three bands in rAAV stocks showing the same pattern as in these figures (data not shown) were presumed to represent artificially reannealed single-stranded rAAV genome in the process of DNA extraction, since these bands were digestible with enzymes that cut the vector. M, months. For the locations of enzyme sites and the probe, see Fig. 1.
FIG. 6
FIG. 6
Analysis of ITR deletions by Southern blotting. (A) Expected vector fragments released from AAV-EF1α-F.IX by various enzyme digestions. (B) Twenty micrograms of liver DNA of C57BL/6 mice injected with AAV-EF1α-F.IX via PV or DL route (3 months postinjection) was digested with the indicated enzymes and hybridized with probe C. Decreased hybridization to a predicted fragment and increased hybridization to a smear in SrfI and NotI digests suggest deletions of the ITRs and their flanking sequences.
FIG. 7
FIG. 7
Further analysis of ITR deletions by Southern blotting. (A) Locations of the BglI sites in AAV-EF1α-F.IX. The expected fragments obtained by BglI digestion are also shown. (B) Twenty micrograms of liver DNAs from C57BL/6 mice injected with a dose of 2.7 × 10¹¹ particles of AAV-EF1α-F.IX were digested with BglI and hybridized with probe A. The time of sacrifice and the route of administration are indicated above each lane. M, months. (C) Schematic representation of deletion of two BglI sites in the ITR. The 4.4-kb band indicates joining of two BglI fragments of 2.4 and 2.1 kb due to deletions of the ITR sequence involving BglI sites.
FIG. 8
FIG. 8
(A) Structures of nine rAAV vector-cellular DNA junctions isolated from transduced mouse liver taken 5 months postinjection. The vector structures 5′ of the BamHI site are not known because of the nature of the strategy. The bold lines and thin lines represent rAAV vector and cellular DNA sequences, respectively. The vertical bars on the lines indicate BamHI sites. Vertical bars across the lines show the ITR, with the strokes roughly representing the lengths of the deleted ITR. The reversed letters show the vector sequences in an inverted orientation. The other nine junctions isolated from the transduced mouse liver taken 9 months postinjection are not shown here; all of them showed simple joining of rAAV and cellular DNA sequences of various sizes. (B) Structures around each junction at the DNA sequence level (for the junction J104, see Fig. 9). Unrearranged vector sequences around the junctions (the ITR and its flanking sequences) are shown, along with the junction sequences isolated from the transduced liver tissue. The numbers above the sequences begin at the 5′ end of the intact vector. The ITR sequences are depicted in two possible orientations (flip and flop). Flanking sequences derived from mouse DNA are shown in lowercase. The arrows show the breakpoints. Nucleotides underlined with duplicated lines indicate residues shared by the vector and the flanking sequences at a junction site, which made it impossible to determine the exact breakpoint. (C) Distribution of the rAAV vector-cellular DNA junctions. One dot represents one break in recombination events. When one junction clone contained more than one breakpoint in the vector sequences, each breakpoint is included.
FIG. 9
FIG. 9
Detailed map of a junction clone, J104, which showed a scrambled alignment of the vector and cellular DNA sequences. (A) The whole structure of the junction fragment isolated. Bold lines indicate the vector sequences, and thin lines represent two kinds of unknown cellular DNA sequences (U1 and U2). Reversed letters on the vector lines indicate inverted orientation of the vector sequences. (B) Nucleotide sequences at each recombination site surrounded by brackets (junctions 1 to 5) in panel A. The vector sequences are in uppercase, while cellular DNA sequences are in lowercase. The nucleotides indicated by double-underlined boldfaced letters indicate a residue or residues shared at junction sites. Portions of unrearranged rAAV vector sequences around the junction sites are shown, along with isolated junction sequences with numbers beginning at the 5′ end of the intact vector. (C) Possible structure of an integration intermediate of J104. The boldfaced solid line and dashed lines represent rAAV vector and cellular DNA sequences, respectively. The vector sequences were presumed to have associated with the host DNA at three points of two DNA strands (P1 and P2 in one DNA strand and P3 in another). The vector and cellular DNA sequences were broken at each site (P1, P2, and P3), and then DNA repair and replication occurred, as shown by a thin line with an arrowhead. In the second round of DNA replication of the bottom cellular DNA strand, DNA polymerase skipped several nucleotides at both junctions P1 and P2 (see the sequencing results). The black boxes on the bold line are ITRs. The structures outside the ITRs in this integration intermediate are not known.

References

    1. Allen J M, Debelak D J, Reynolds T C, Miller D. Identification and elimination of replication-competent adeno-associated virus (AAV) that can arise by nonhomologous recombination during AAV vector production. J Virol. 1997;71:6816–6822. - PMC - PubMed
    1. Balagué C, Kalla M, Zhang W-W. Adeno-associated virus Rep78 protein and terminal repeats enhance integration of DNA sequences into the cellular genome. J Virol. 1997;71:3299–3306. - PMC - PubMed
    1. Cheung A K M, Hoggan M D, Hauswirth W W, Berns K I. Integration of the adeno-associated virus genome into cellular DNA in latently infected human Detroit 6 cells. J Virol. 1980;33:739–748. - PMC - PubMed
    1. Clark K R, Sferra T J, Johnson P R. Recombinant adeno-associated virus vectors mediate long-term transgene expression in muscle. Hum Gene Ther. 1997;8:659–669. - PubMed
    1. Craigie R. Hotspots and warmspots: integration specificity of retroelements. Trends Genet. 1992;8:187–190. - PubMed

Publication types

MeSH terms