

Monocyte activation in patients with Wegener's granulomatosis
- PMID: 10364903
- PMCID: PMC1752857
- DOI: 10.1136/ard.58.4.237
Monocyte activation in patients with Wegener's granulomatosis
Abstract
Objective: Wegener's granulomatosis (WG) is an inflammatory disorder characterised by granulomatous inflammation, vasculitis, and necrotising vasculitis and is strongly associated with anti-neutrophil cytoplasmic antibodies (ANCA). Activated monocytes/macrophages are present in renal biopsy specimens and participate in granuloma formation by synthesising and secreting a variety of chemoattractants, growth factors, and cytokines. In view of these findings, in vivo monocyte activation was evaluated in patients with WG and the findings related to parameters of clinical disease activity.
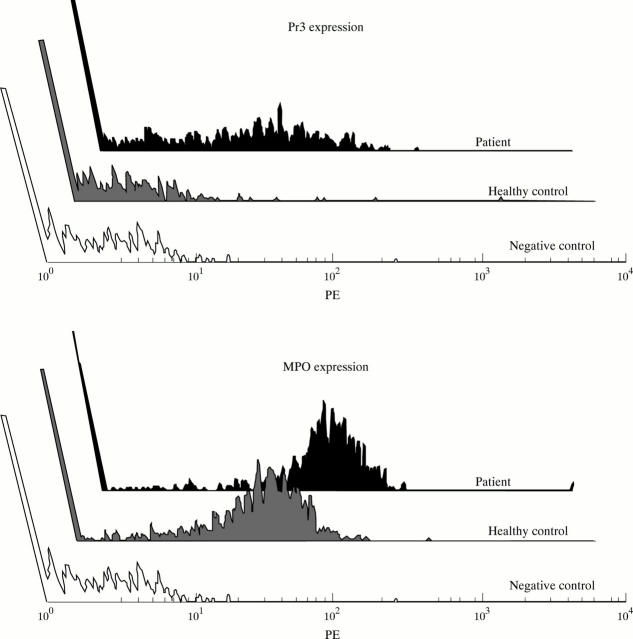
Methods: Monocyte activation was analysed by measuring plasma concentrations of soluble products of monocyte activation, that is neopterin and interleukin 6 (IL6), by ELISA, and by quantitating the surface expression of activation markers on circulating monocytes by flow cytometry.
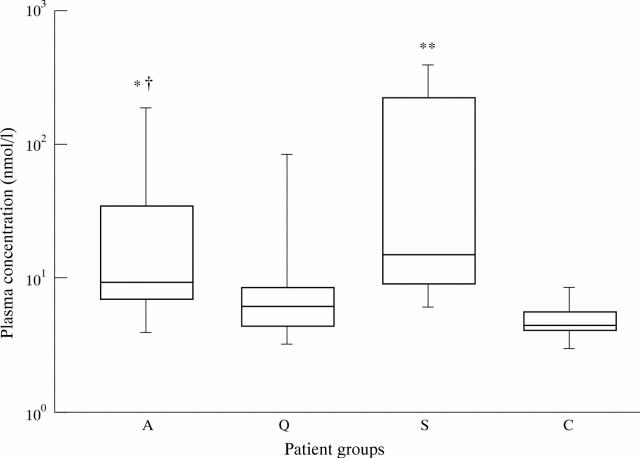
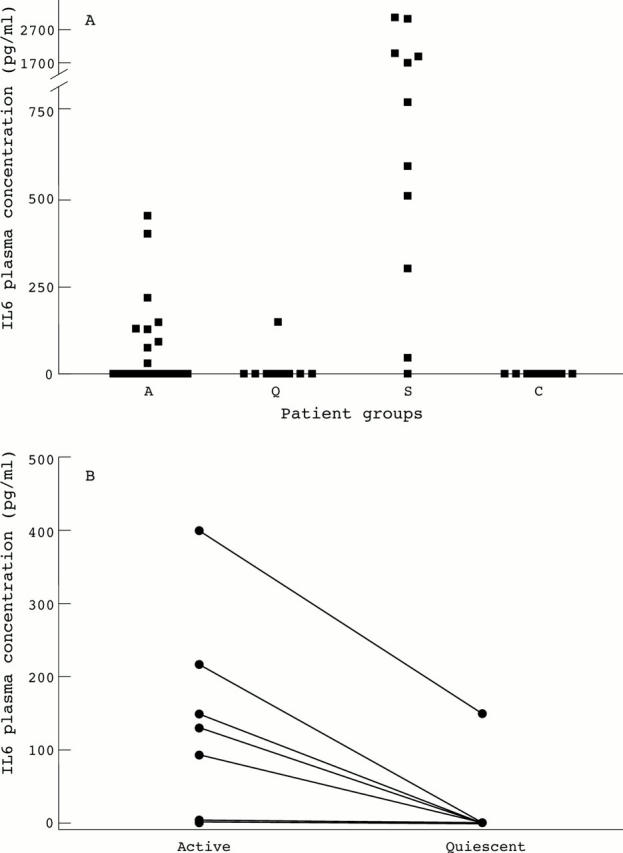
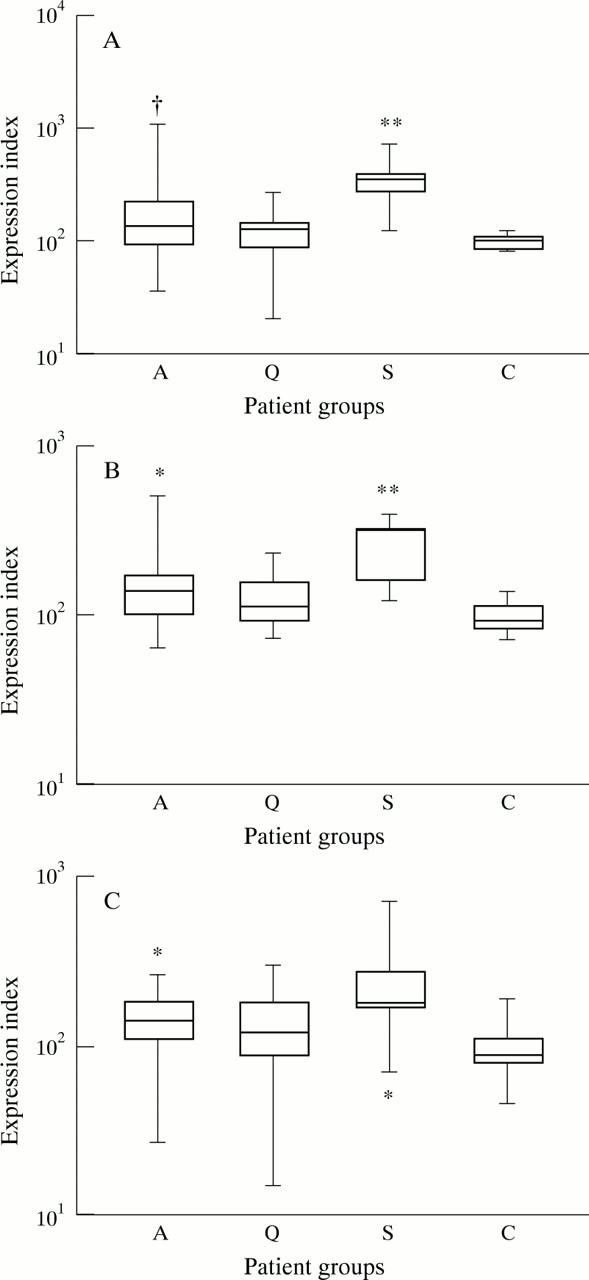
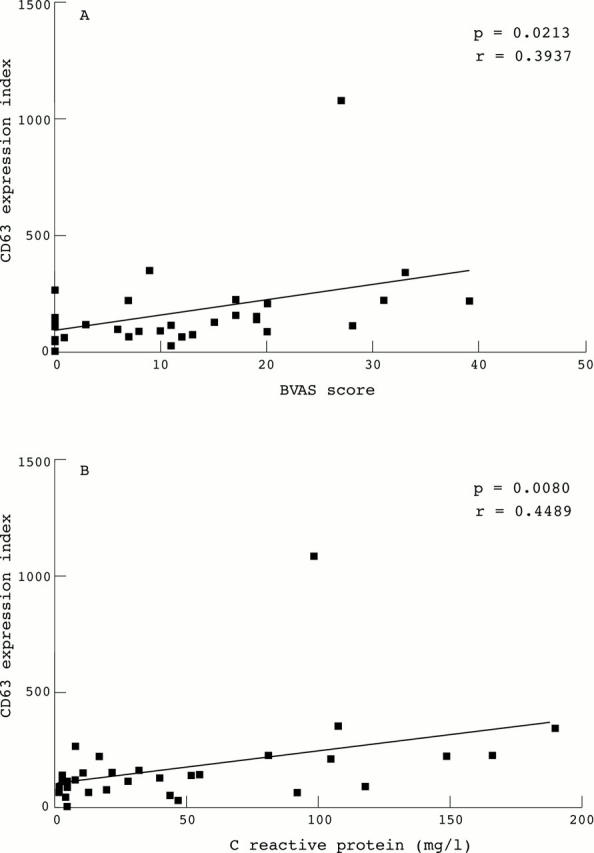
Results: Twenty-four patients with active WG were included in this study. Ten of these patients were also analysed at the time of remission. Twelve patients with sepsis served as positive controls, and 10 healthy volunteers as negative controls for monocyte activation. Patients with active disease had increased monocyte activation compared with healthy controls as shown by increased concentrations of neopterin (p < 0.0001) and increased surface expression of CD11b (p < 0.05) and CD64 (p < 0.05). In those patients with increased concentrations of IL6 during active disease plasma concentrations of IL6 decreased during follow up when patients went into remission (p < 0.0001). In addition, neopterin (r = 0.37, r = 0.44), IL6 (r = 0.37, r = 0.60) and CD63 expression (r = 0.39, r = 0.45) correlated significantly with disease activity as measured by the Birmingham Vasculitis Activity Score and C reactive protein values, respectively. Compared with patients with sepsis, all markers of monocyte activation in patients with vasculitis were lower.
Conclusion: It is concluded that disease activity in WG correlates with the extent of activation of monocytes, compatible with their role in the pathophysiology of this disease.
Figures
References
Publication types
MeSH terms
Substances
LinkOut - more resources
Full Text Sources
Other Literature Sources
Medical
Research Materials
Miscellaneous
