

Activation and inactivation of the voltage-gated sodium channel: role of segment S5 revealed by a novel hyperkalaemic periodic paralysis mutation
- PMID: 10366610
- PMCID: PMC6782655
- DOI: 10.1523/JNEUROSCI.19-12-04762.1999
Activation and inactivation of the voltage-gated sodium channel: role of segment S5 revealed by a novel hyperkalaemic periodic paralysis mutation
Abstract
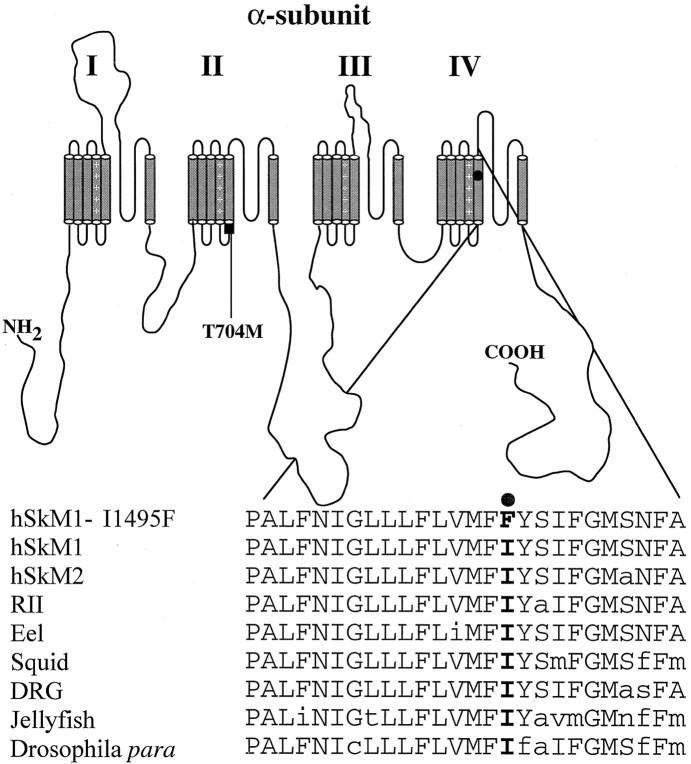
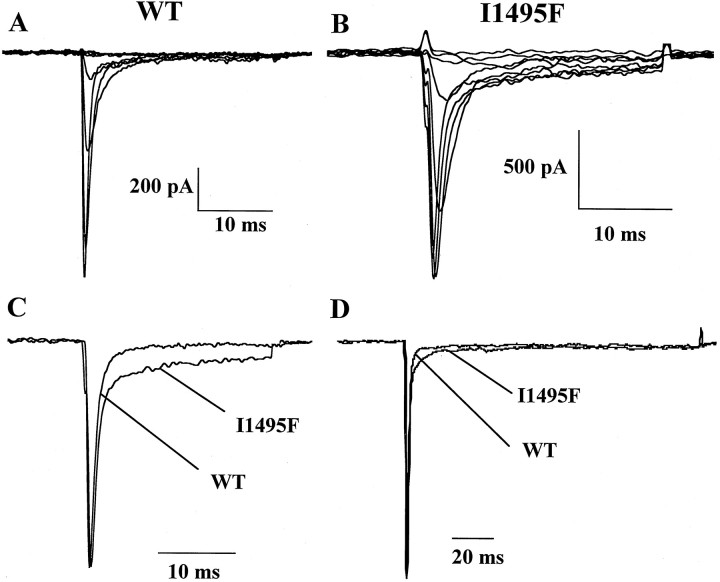
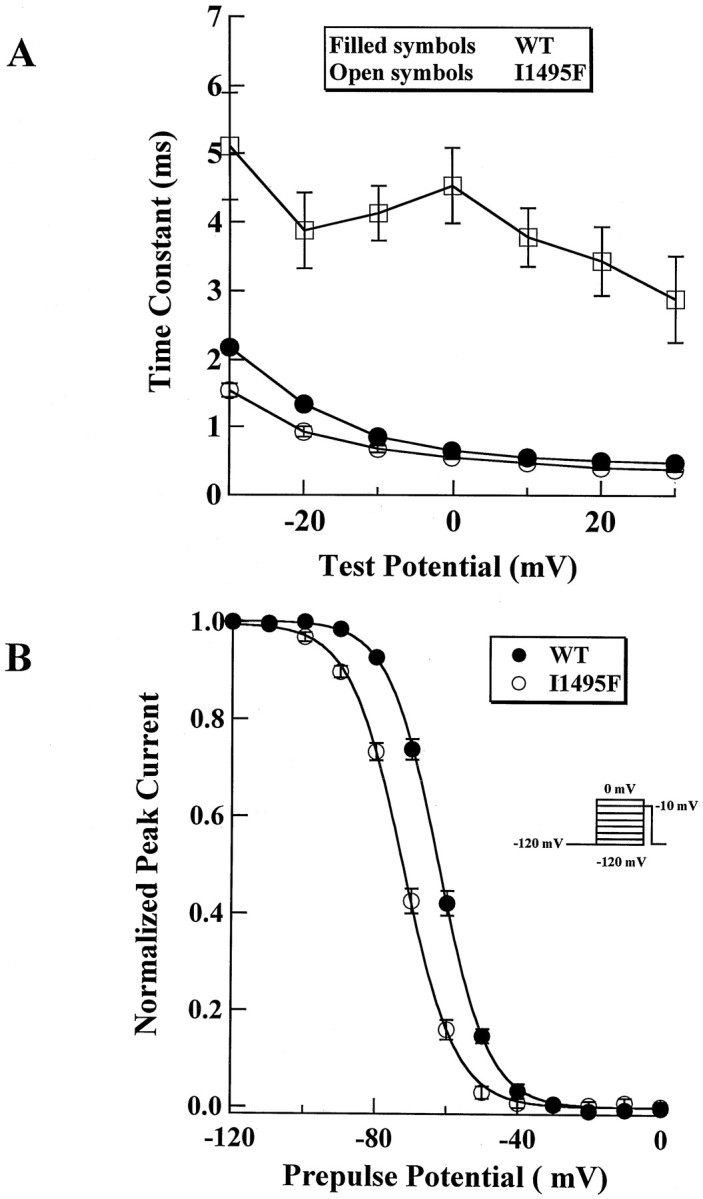
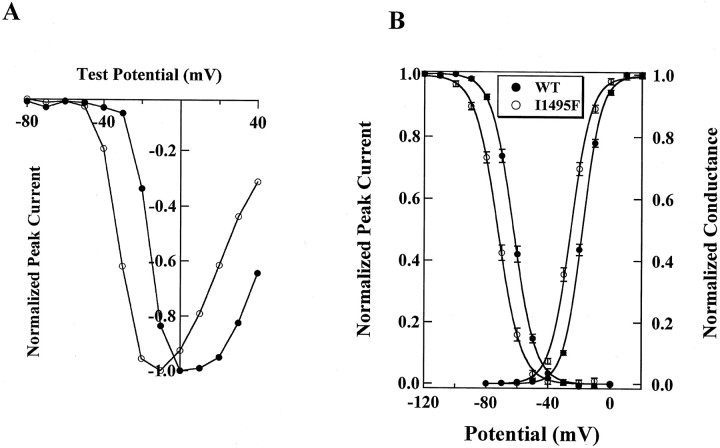
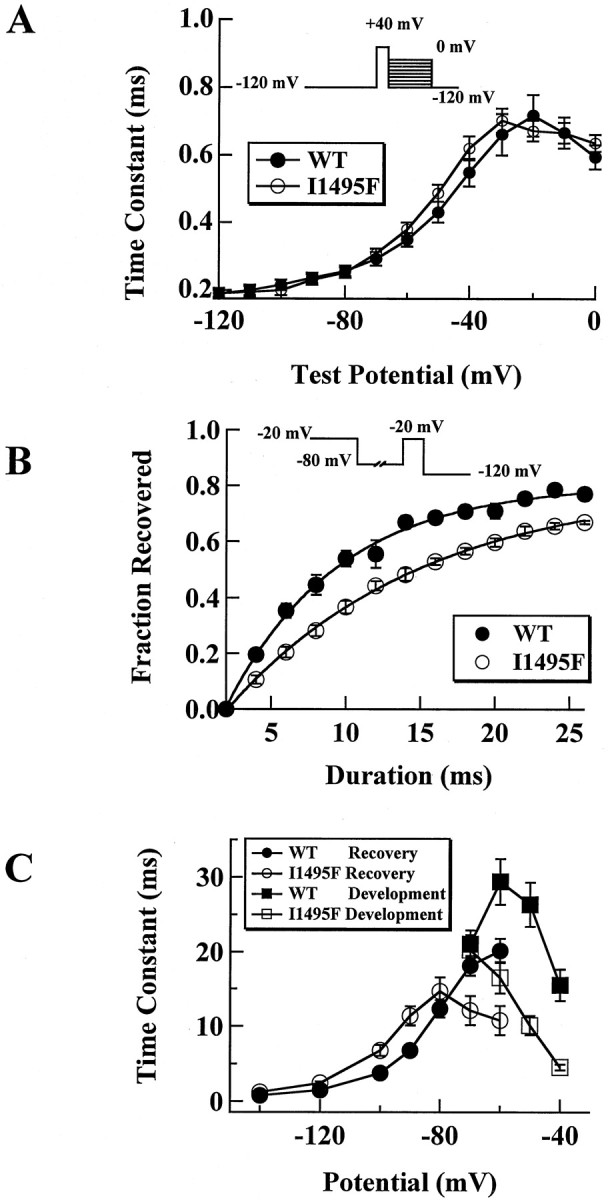
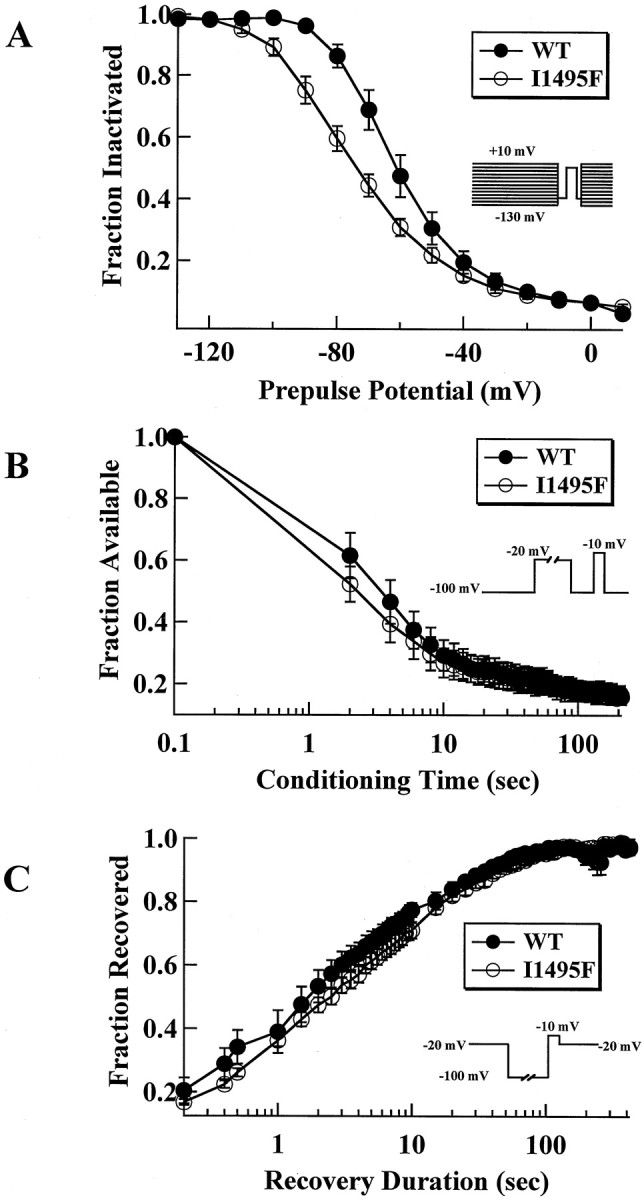
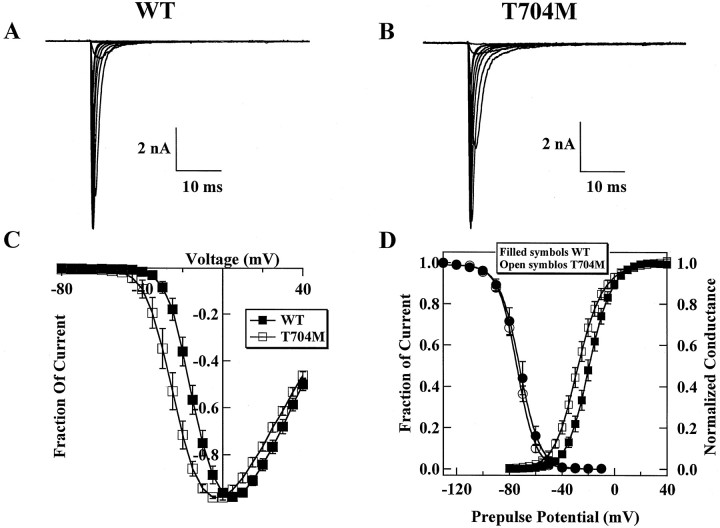
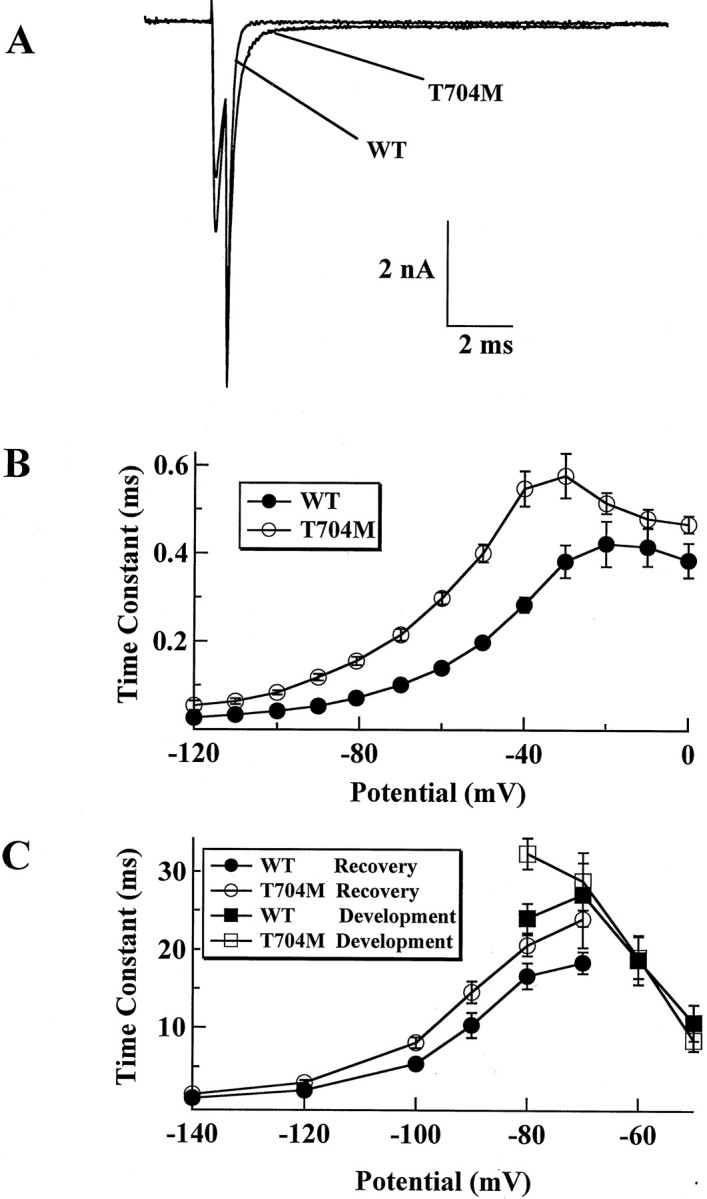
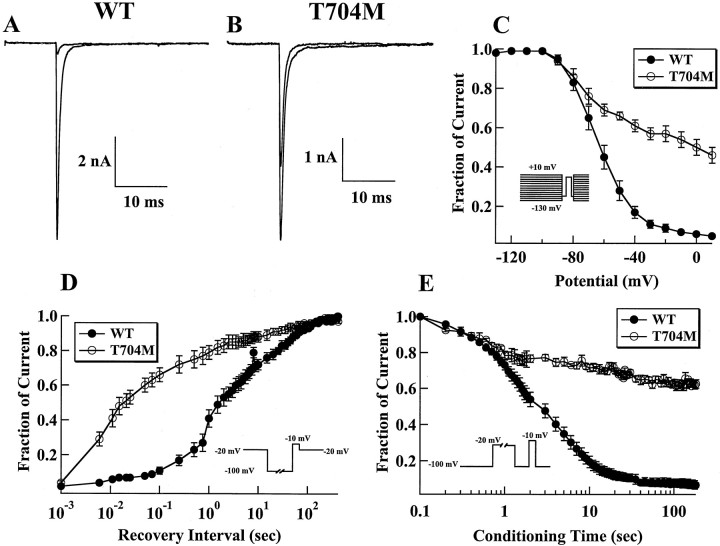
Hyperkalaemic periodic paralysis, paramyotonia congenita, and potassium-aggravated myotonia are three autosomal dominant skeletal muscle disorders linked to the SCN4A gene encoding the alpha-subunit of the human voltage-sensitive sodium channel. To date, approximately 20 point mutations causing these disorders have been described. We have identified a new point mutation, in the SCN4A gene, in a family with a hyperkalaemic periodic paralysis phenotype. This mutation predicts an isoleucine-to-phenylalanine substitution at position 1495 located in the transmembrane segment S5 in the fourth homologous domain of the human alpha-subunit sodium channel. Introduction of the I1495F mutation into the wild-type channels disrupted the macroscopic current inactivation decay and shifted both steady-state activation and inactivation to the hyperpolarizing direction. The recovery from fast inactivation was slowed, and there was no effect on channel deactivation. Additionally, a significant enhancement of slow inactivation was observed in the I1495F mutation. In contrast, the T704M mutation, a hyperkalaemic periodic paralysis mutation located in the cytoplasmic interface of the S5 segment of the second domain, also shifted activation in the hyperpolarizing direction but had little effect on fast inactivation and dramatically impaired slow inactivation. These results, showing that the I1495F and T704M hyperkalaemic periodic paralysis mutations both have profound effects on channel activation and fast-slow inactivation, suggest that the S5 segment maybe in a location where fast and slow inactivation converge.
Figures
Similar articles
-
A double mutation in families with periodic paralysis defines new aspects of sodium channel slow inactivation.J Clin Invest. 2000 Aug;106(3):431-8. doi: 10.1172/JCI9654. J Clin Invest. 2000. PMID: 10930446 Free PMC article.
-
Salbutamol treatment in a patient with hyperkalaemic periodic paralysis due to a mutation in the skeletal muscle sodium channel gene (SCN4A).J Neurol Neurosurg Psychiatry. 1998 Aug;65(2):248-50. doi: 10.1136/jnnp.65.2.248. J Neurol Neurosurg Psychiatry. 1998. PMID: 9703181 Free PMC article.
-
N1366S mutation of human skeletal muscle sodium channel causes paramyotonia congenita.J Physiol. 2017 Nov 15;595(22):6837-6850. doi: 10.1113/JP274877. Epub 2017 Oct 15. J Physiol. 2017. PMID: 28940424 Free PMC article.
-
[Familial hyperkalemic periodic paralysis: a brief review of the adult human skeletal muscle sodium channel and the application of LA-PCR to the SCN4A gene analysis].Nihon Rinsho. 1997 Dec;55(12):3253-8. Nihon Rinsho. 1997. PMID: 9436446 Review. Japanese.
-
The skeletal muscle sodium and chloride channel diseases.Brain. 1995 Apr;118 ( Pt 2):547-63. doi: 10.1093/brain/118.2.547. Brain. 1995. PMID: 7735894 Review.
Cited by
-
A double mutation in families with periodic paralysis defines new aspects of sodium channel slow inactivation.J Clin Invest. 2000 Aug;106(3):431-8. doi: 10.1172/JCI9654. J Clin Invest. 2000. PMID: 10930446 Free PMC article.
-
SCN5A variant that blocks fibroblast growth factor homologous factor regulation causes human arrhythmia.Proc Natl Acad Sci U S A. 2015 Oct 6;112(40):12528-33. doi: 10.1073/pnas.1516430112. Epub 2015 Sep 21. Proc Natl Acad Sci U S A. 2015. PMID: 26392562 Free PMC article.
-
Reduced Na(+) and higher K(+) channel expression and function contribute to right ventricular origin of arrhythmias in Scn5a+/- mice.Open Biol. 2012 Jun;2(6):120072. doi: 10.1098/rsob.120072. Open Biol. 2012. PMID: 22773948 Free PMC article.
-
Proton sensors in the pore domain of the cardiac voltage-gated sodium channel.J Biol Chem. 2013 Feb 15;288(7):4782-91. doi: 10.1074/jbc.M112.434266. Epub 2013 Jan 2. J Biol Chem. 2013. PMID: 23283979 Free PMC article.
-
Enhanced slow inactivation of the human skeletal muscle sodium channel causing normokalemic periodic paralysis.Cell Mol Neurobiol. 2014 Jul;34(5):707-14. doi: 10.1007/s10571-014-0052-y. Epub 2014 Mar 29. Cell Mol Neurobiol. 2014. PMID: 24682880 Free PMC article.
References
-
- Baquero JL, Ayala RA, Wang JZ, Curless RG, Feero WG, Hoffman EP, Ebeid MR. Hyperkalemic periodic paralysis with cardiac dysrhythmia: a novel sodium channel mutation. Ann Neurol. 1995;37:408–411. - PubMed
-
- Bulman DE. Phenotype variation and newcomers in ion channel disorders. Hum Mol Genet. 1997;10:1679–1685. - PubMed
-
- Cannon SC. Slow sodium channel inactivation need not be disrupted in the pathogenesis of myotonia and periodic paralysis. Biophys J. 1994;66:543–545.
-
- Cannon SC, Strittmatter SM. Functional expression of sodium channel mutations identified in families with periodic paralysis. Neuron. 1993;10:317–326. - PubMed
Publication types
MeSH terms
Substances
Grants and funding
LinkOut - more resources
Full Text Sources
Other Literature Sources