. 1999 Jun 15;19(12):4855-66.
doi: 10.1523/JNEUROSCI.19-12-04855.1999.

Endocytic active zones: hot spots for endocytosis in vertebrate neuromuscular terminals

Affiliations

Endocytic active zones: hot spots for endocytosis in vertebrate neuromuscular terminals

H Teng et al. J Neurosci. .

Abstract

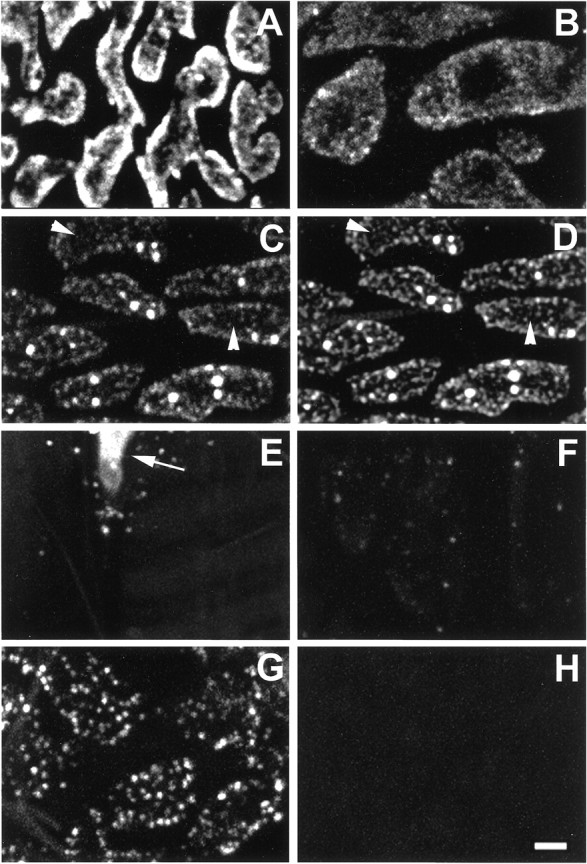
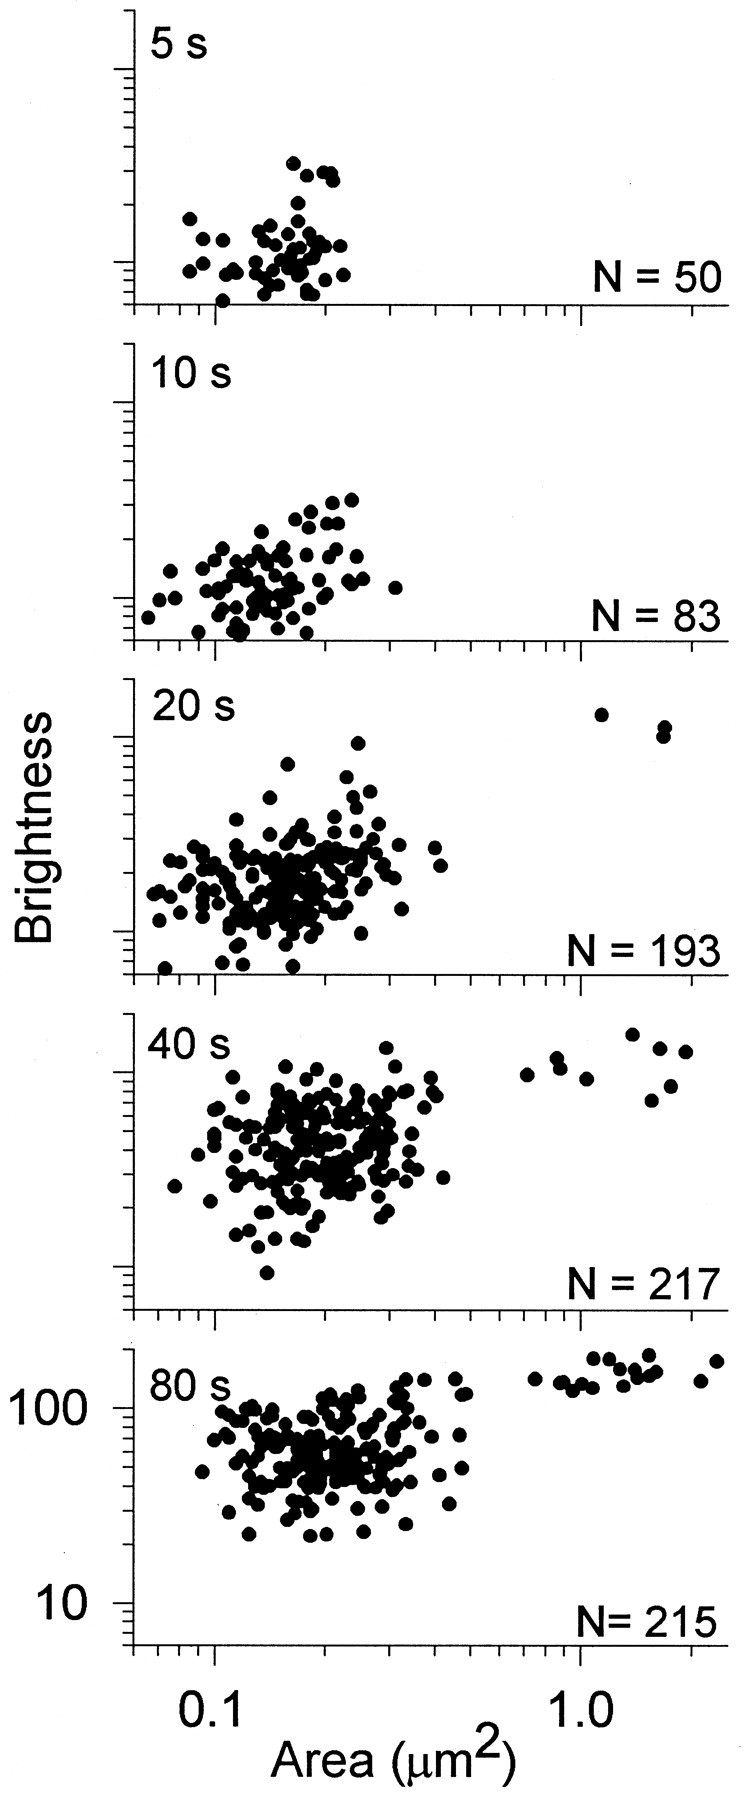
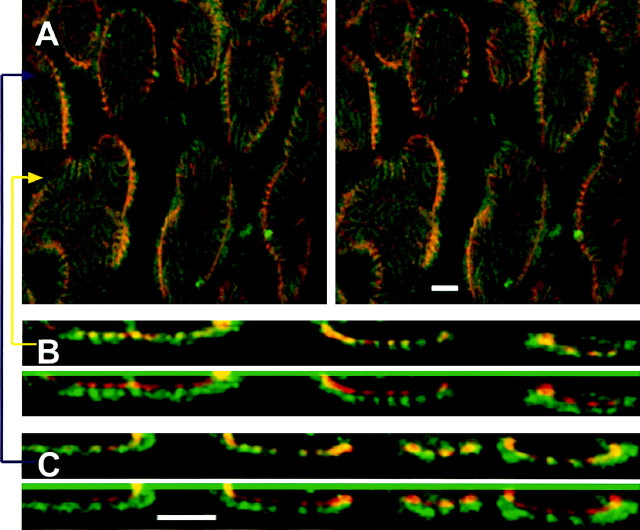
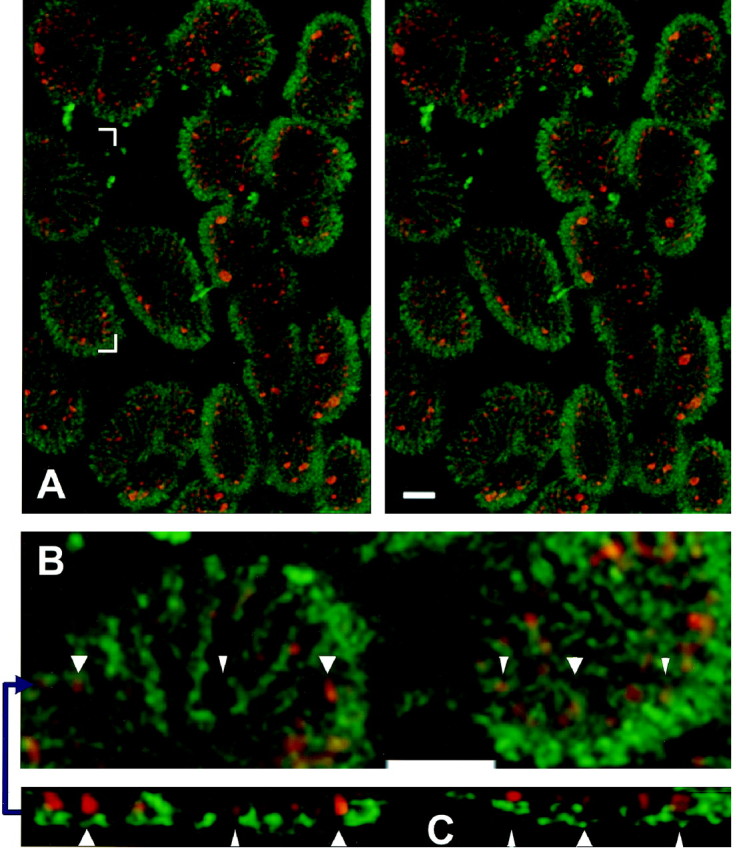
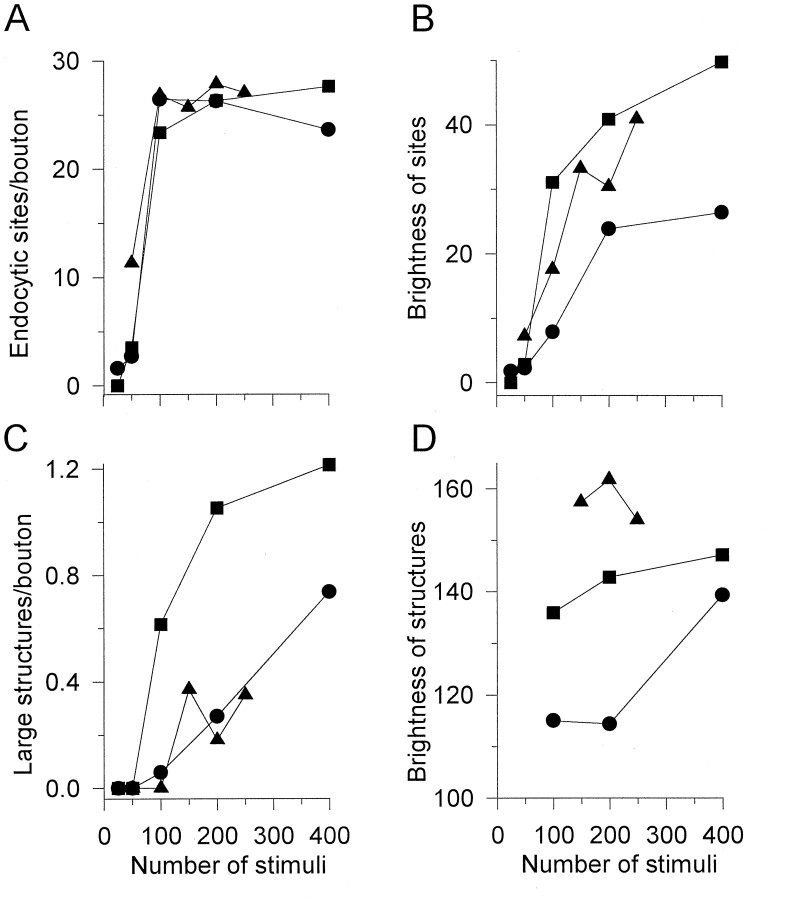
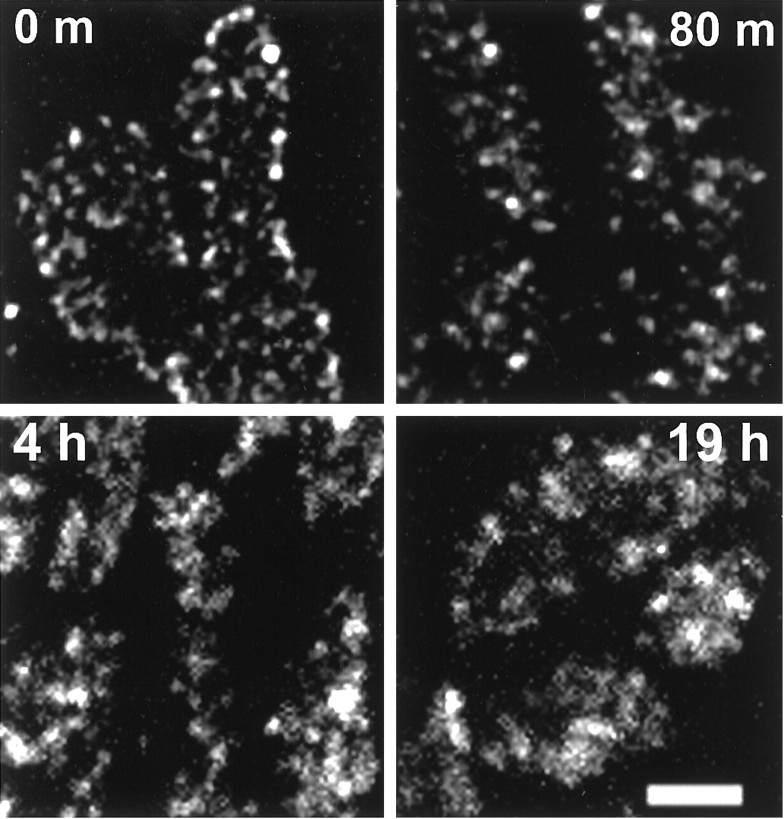
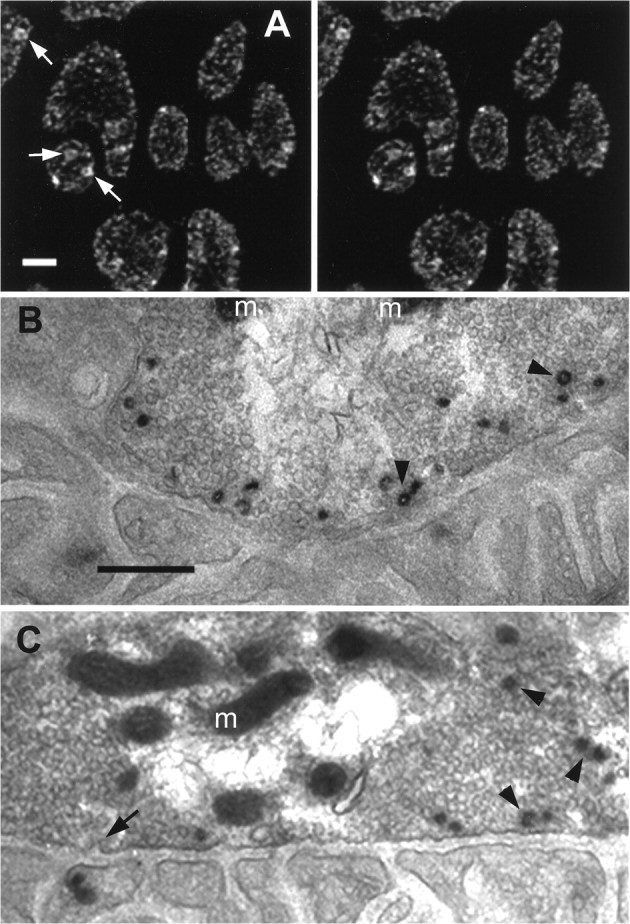
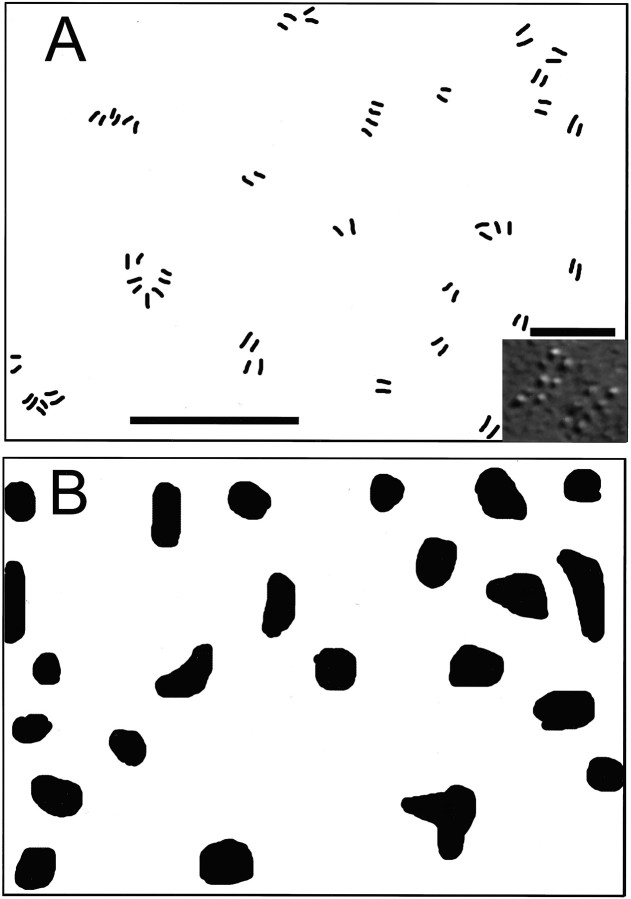
We have used a sensitive activity-dependent probe, sulforhodamine 101 (SR101), to view endocytic events within snake motor nerve terminals. After very brief neural stimulation at reduced temperature, SR101 is visualized exclusively at punctate sites located just inside the presynaptic membrane of each terminal bouton. The number of sites (approximately 26 sites/bouton) and their location (in register with postsynaptic folds) are similar to the number and location of active zones in snake motor terminals, suggesting a spatial association between exocytosis and endocytosis under these stimulus conditions. With more prolonged stimulation, larger SR101-containing structures appear at the bouton margins. Thus endocytosis occurs initially at distinct sites, which we call "endocytic active zones," whereas further stimulation recruits a second endocytic paradigm.


Figures

Fig. 1.
Fig. 1.
Characteristics of SR101 uptake. Eachpanel in this and subsequent figures shows a region (a few of ∼60 boutons) of one motor nerve terminal reconstructed from a stack of 15–40 diffraction-limited confocal images.A, Moderate stimulation (25 Hz; 1 sec on and 1 sec off for 30 sec) at RT is shown. Boutons were nearly filled with dye.B, Low-frequency stimulation (5 Hz; 25 sec) at RT diminished staining intensity and revealed a punctate pattern.C, Stimulation at ∼7°C (5 Hz; 30 sec) enhanced the punctate character of staining, revealing distinct small dots (arrowheads) and larger near-spherical structures. D, The same image presented in C after digital deconvolution is shown. The overall focus and contrast of the dots(arrowheads) are improved. E, An unstimulated control terminal (40 min in SR101 bath; RT) is shown; thearrow points to the terminal’s myelinated axon.F, A destained terminal (the same snake and staining protocol used in C) resulting from additional stimulation (25 Hz; 90 min; RT) in SR101-free bath is shown.G, Brief chemical stimulation (60 mmK+; 15 sec) produced the same punctate-staining pattern as did neural stimulation (compare with D).H, Dye uptake requires Ca2+. The snake and protocol were the same as that used in G, but stimulation was in a bath containing no added Ca2+. Scale bar, 2 μm.
Fig. 2.
Fig. 2.
SR101-staining patterns resulting from 5 Hz stimulation of various durations. A–E1, From one snake.E2–H, From a different snake. A,Small dots that were first visible after 5 sec.B–E1, Patterns from 10, 20, 40, and 80 sec stimulation, respectively. Note the monotonic increases in brightness and number of dots, plus the appearance of large structures. E2–H, Patterns from 80, 160, 320, and 640 sec stimulation, respectively. Punctate character is obscured as boutons fill with dye. Photomultiplier gain is reduced inE2–H to prevent saturation. Scale bar, 2 μm.
Fig. 3.
Fig. 3.
Two types of activity-dependent staining in motor boutons. Shown are double-logarithmic scatterplots comparing two properties, area and brightness, of stained structures in boutons from one snake. Each panel represents one muscle stimulated at 5 Hz for the time indicated. Data points represent all visible structures in nine boutons (3 terminals) from each muscle (total shown at right). Two nonoverlapping populations of structures were seen (clusters at left andright). Small dots (left) increased in brightness as more stimuli were delivered. Large structures (right) were uniformly bright but appeared only in preparations receiving ≥100 stimuli. s, Second.
Fig. 4.
Fig. 4.
Confocal imaging of synaptic membrane and postsynaptic folds. Deconvolved images show light-level colocalization of the basal lamina-specific lectin FITC-VVA (green; synaptic cleft) and the anti-AChR monoclonal mAb22 (red; postsynaptic membrane).A, Stereo view from above, looking through a small region of one nerve terminal toward the muscle below. Note thepeanut-shell shapes of boutons’ invaginations into muscle fiber; this curved surface also identifies the presynaptic membrane within light resolution.Fingerprint-like stripes are postsynaptic folds, which can be seen to radiate into the muscle fiber at the edges of boutons. B, Top, Magnifiedxz cross section at the yellow arrow in A. Bottom,Red and green images displaced vertically so that the labels can be viewed individually. C, Magnified xz views as inB taken at the blue arrow inA. Folds are visible and nearly coincident with both labels. Scale bars, 2 μm.
Fig. 5.
Fig. 5.
Endocytic sites oppose postsynaptic folds.A, Stereo view as in Figure 4 with the synaptic cleft (FITC-VVA) shown in green. After stimulation (5 Hz; 45 sec), SR101 (red) was internalized at endocytic sites (small dots) and at a few large structures. Sites are confined to loci just inside and congruent with the presynaptic membrane. Moreover, the sites are associated with folds (note especially the edges of boutons).B, Magnified nonstereo view of the bracketed region in A. White arrowheadspoint to six sites. C, View in thexz plane at the blue arrow in B, showing positions of sites just above the folds. White arrowheads point to the same six sites as the white arrowheads in B. Scale bars, 2 μm.
Fig. 6.
Fig. 6.
The number of endocytic sites in a bouton is fixed. Data from three snakes (circles,triangles, squares) are shown. Each of five muscles from each snake received a precise number of stimuli in the presence of SR101 (5 Hz; x-axis inAD). Dots and large structures were analyzed in 33–161 boutons from each muscle. A, The number of visible small endocytic sites increased rapidly with initial stimulation and then remained at a density corresponding to ∼26 sites per average-sized bouton. B, The mean brightness of sites increased monotonically with stimulation. C, The number of visible large structures (putative endosomes) was 0 for 25 and 50 stimuli and then rose monotonically with further stimulation.D, Large structures were brighter than endocytic sites, but their brightness was relatively insensitive to stimulation time; note the expanded brightness scale compared with that inB.
Fig. 7.
Fig. 7.
Internalized vesicles at endocytic sites comprise discrete stable pools. Four muscles from one snake were stimulated in an SR101 bath (5 Hz; 30 sec), kept living in reptilian saline (4°C) without further stimulation for the time indicated, and then fixed. Shown are boutons from a typical terminal in each muscle. The labeled vesicles dispersed somewhat but remained in discrete pools, presumably near their original endocytic site. h, Hour;m, minute. Scale bar, 2 μm.
Fig. 8.
Fig. 8.
Labeled structures were probably vesicle clusters and endosomes. A, Uptake of the membrane-permeant dye FM1-43 was similar to that of the aqueous dye SR101 but permitted photoconversion for EM. Shown is the staining pattern (stereo view) obtained after brief stimulation (5 Hz; 40 sec) at ∼7°C and fixation as described in Materials and Methods (compare with Fig.2D). Large structures often appeared hollow (arrows), suggesting that they were bound by a membrane and were not clusters of vesicles. B, C, Shown are example EMs of photoconverted FM1-43 from two boutons, as inA but with briefer stimulation (5 Hz; 30 sec) at ∼7°C so that most or all of the internalized dye appeared assmall dots.Sections shown are nearly tangential to the muscle fiber surface and close to the region of the bouton’s deepest invagination. The postsynaptic membrane and its folds arebelow, with the vesicle-filled boutonabove (m, mitochondria). Vesicles containing recently internalized FM1-43 were almost exclusively near the presynaptic membrane, the same location as the small dots seen at light level. Putative endocytic profiles (arrow) appeared in the presynaptic membrane. Some labeled vesicles were coated (arrowheads) as were some endocytic profiles (arrow). Scale bars:A, 2 μm; B, C, 0.5 μm.
Fig. 9.
Fig. 9.
Relationship between exocytic and endocytic active zones in snake boutons. Camera lucida drawings. A, Region of freeze–fracture replica showing locations of exocytic active zones in the presynaptic membrane. Each double line array represents one active zone (example shown ininset). B, Region of presynaptic membrane of bouton stimulated (5 Hz; 20 sec) in the presence of SR101 using the protocol of Figure 2C. The pattern and density of endocytic sites are similar to those of active zones inA. Scale bars: A, B, 1 μm; inset in A, 100 nm.

Similar articles

Cited by

References

    1. Anderson RGW, Brown MS, Goldstein JL. Role of the coated endocytic vesicle in the uptake of receptor-bound low density lipoprotein in human fibroblasts. Cell. 1977;10:351–364. - PubMed
    1. Angleson JK, Betz WJ. Monitoring secretion in real time: capacitance, amperometry and fluorescence compared. Trends Neurosci. 1997;20:281–287. - PubMed
    1. Balice-Gordon RJ, Chua CK, Nelson CC, Lichtman JW. Gradual loss of synaptic cartels precedes axon withdrawal at developing neuromuscular junctions. Neuron. 1993;11:801–815. - PubMed
    1. Betz WJ, Bewick GS. Optical monitoring of transmitter release and synaptic vesicle recycling at the frog neuromuscular junction. J Physiol (Lond) 1993;460:287–309. - PMC - PubMed
    1. Betz WJ, Mao F, Bewick GS. Activity-dependent fluorescent staining and destaining of living vertebrate motor nerve terminals. J Neurosci. 1992;12:363–375. - PMC - PubMed

Publication types

MeSH terms

LinkOut - more resources