. 1999 Jun 15;19(12):5108-18.
doi: 10.1523/JNEUROSCI.19-12-05108.1999.

Gradual emergence of song selectivity in sensorimotor structures of the male zebra finch song system

Affiliations

Gradual emergence of song selectivity in sensorimotor structures of the male zebra finch song system

P Janata et al. J Neurosci. .

Abstract

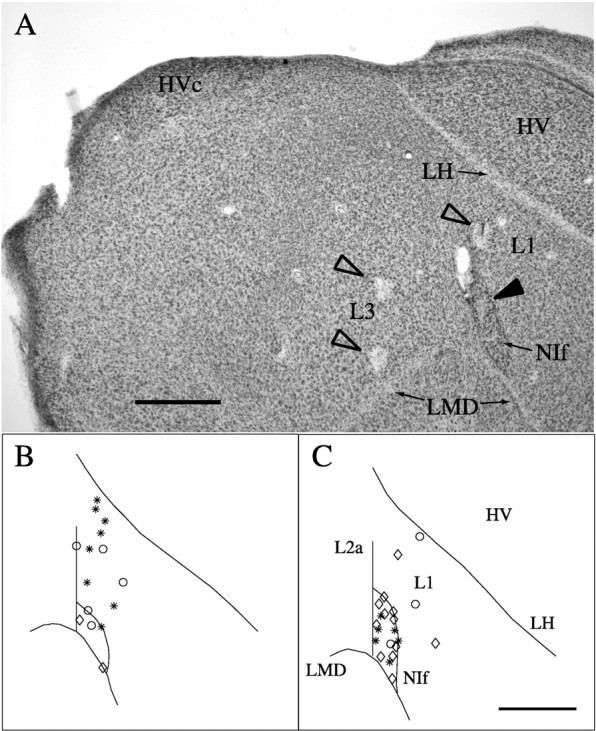
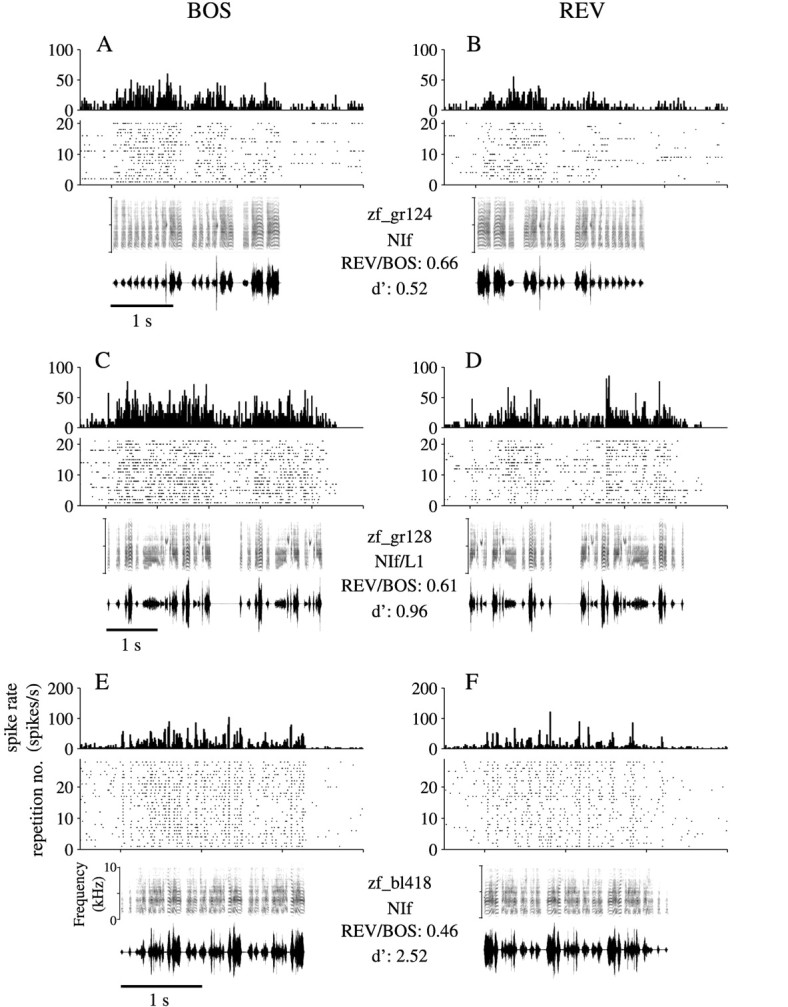
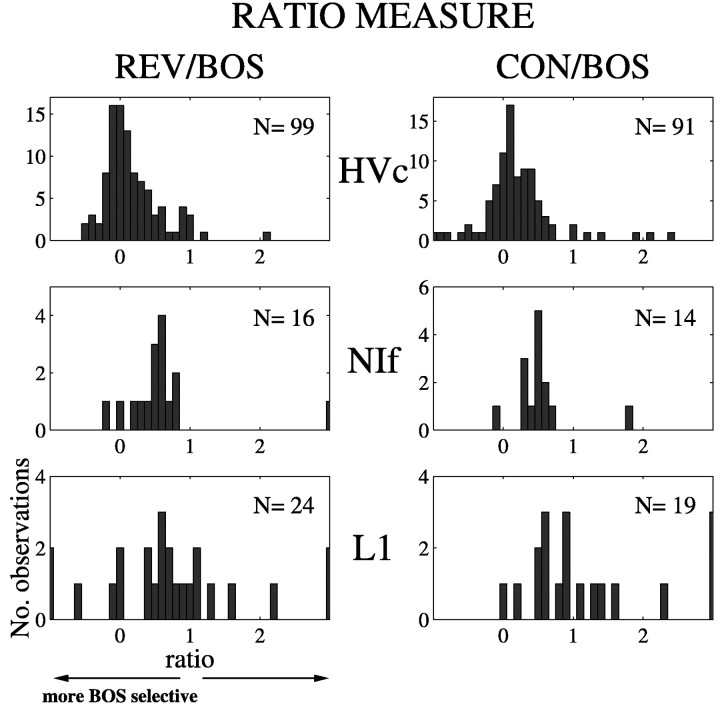
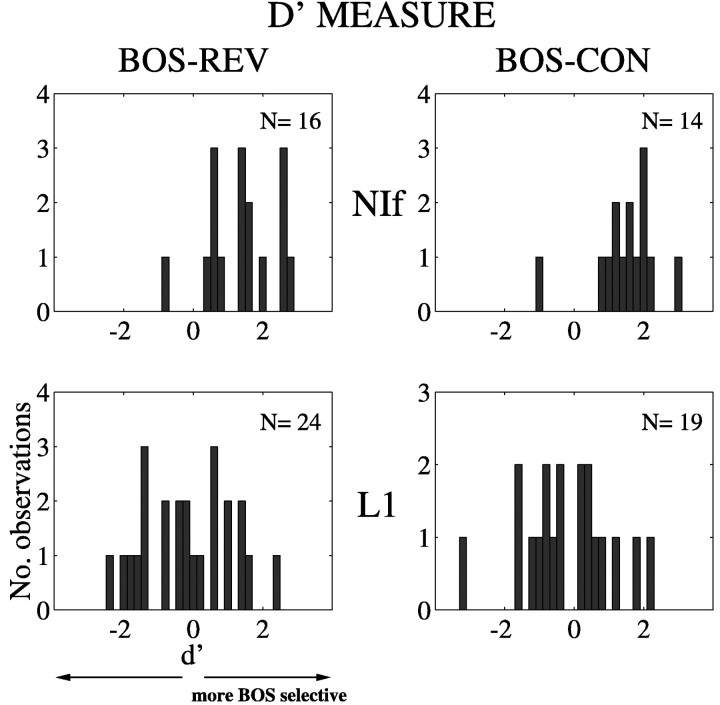
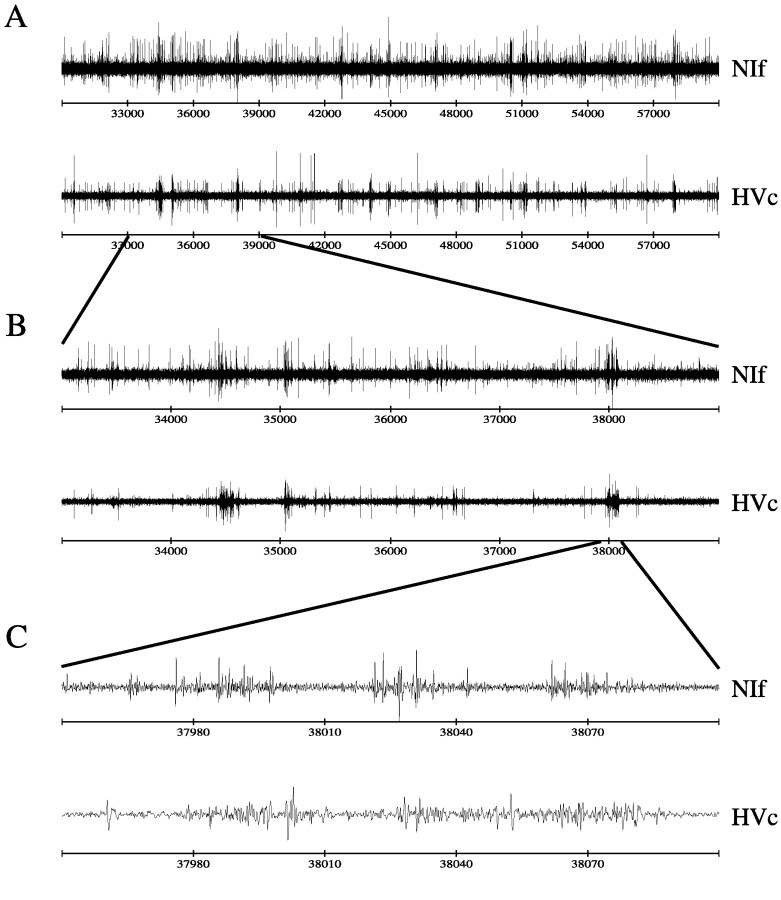
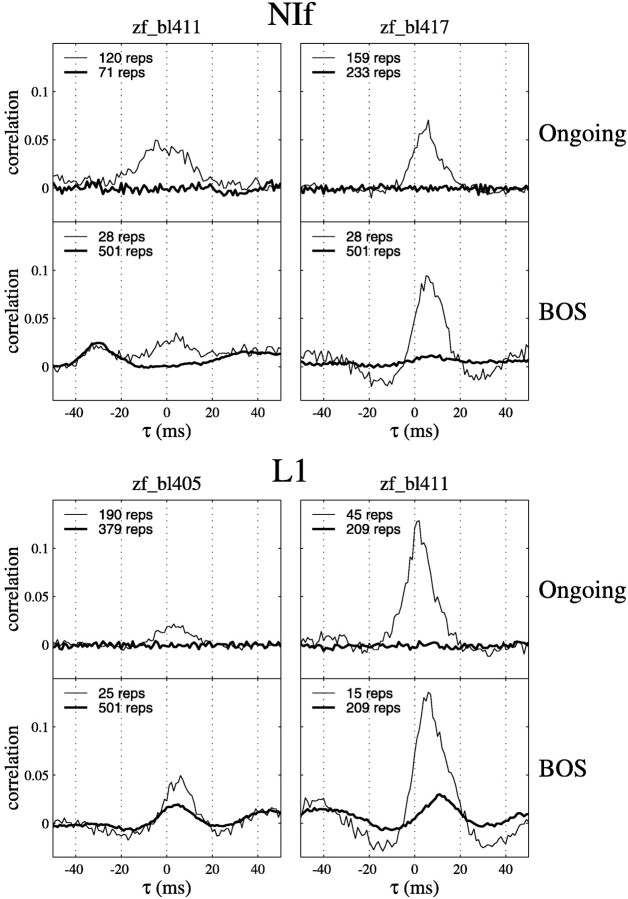
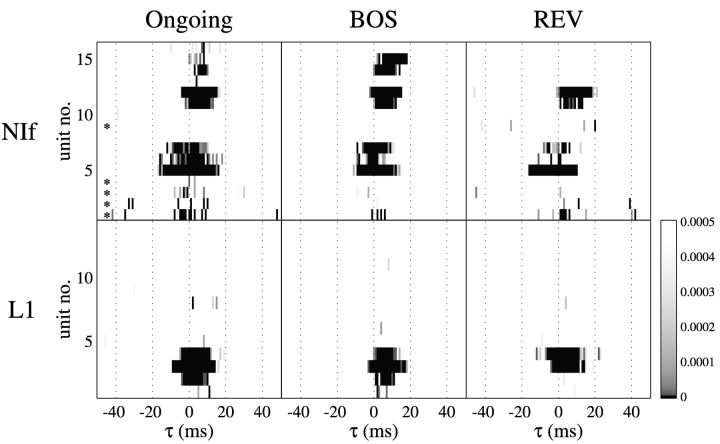
Birdsong is a model system for understanding how motor and sensory information interact to coordinate behavior. Neurons in one potential site of sensorimotor integration, the forebrain nucleus HVc, have premotor activity during singing and auditory activity during playback of the bird's own song. It is not known whether the high degree of selectivity for learned features of song observed during playback arises in HVc or also in structures afferent to HVc. We recorded in anesthetized adult zebra finches from two structures afferent to HVc: either the nucleus interfacialis (NIf) or the L1 subdivision of the field L complex, and simultaneously from a second electrode in HVc. Correlations in the bursting pattern of ongoing activity of HVc and NIf recordings were observed; these helped to localize the first electrode to NIf recording sites. Most NIf neurons exhibited song-selective responses, but as a population, they were less selective than were HVc neurons. Most L1 neurons were not song-selective. NIf neurons have also been reported to have premotor activity during singing; thus, NIf is another potential site of auditory-motor interactions in the song system. Evidence gathered to date suggests that those brain areas in the passerine forebrain that are recruited during song production also display the most selective learned auditory responses.


Figures

Fig. 1.
Fig. 1.
Anatomical locations of recording sites.A, Cresyl violet-stained material in a parasagittal section showing sites of electrolytic lesions in L3, L1 (open arrowheads), and NIf (filled arrowhead). NIf is the darkly staining oval nucleus at the bottom right. HVc is at the top left. The lesion in NIf marks the site from which the data illustrated in Figure 2,E and F, were acquired. Scale bar, 500 μm. B, A map of NIf and L1 single-unit recording sites on a standardized schematic of a parasagittal section through the medial aspect of NIf. Asterisks denote recording sites that were either 0–50 μm from a lesion site or along an electrode track with two lesions visible in the same section.Circles denote recording sites along electrode tracks marked with a single lesion and other indication of the orientation of the track, or along electrode tracks without lesions in the same section as a parallel track marked by two lesions. Sites along tracks in sections not possessing lesions, but adjacent to sections with lesions, are marked by diamonds. C, A map of NIf and L1 single-unit recording sites on a standardized schematic of a parasagittal section through the lateral aspect of NIf. Samesymbols as in B. Scale bar (inC): B, C, 500 μm.
Fig. 2.
Fig. 2.
Responses of NIf single units to complex auditory stimuli. The activity patterns from three birds of two single NIf neurons and one neuron on the border of NIf and L1 are illustrated in response to playback of the BOS (left column) and REV (right column). For each unit, a PSTH is shownabove a raster plot, which indicates the times of spike occurrences arranged as dots in horizontal rows. The PSTHs and rasters are aligned with the spectrographs and oscillographs shown below the raster. Two values of two song selectivity metrics, the REV/BOS ratio and d′, are indicated below each bird’s name between the BOS and REV columns. The recordings for bird zf_bl418 (E,F) were acquired from the site of the NIf lesion shown in Figure 1.
Fig. 3.
Fig. 3.
Comparison of song selectivity of HVc, NIf, and L1 single units. Song selectivity was quantified by a ratio expressed as the mean firing rate in response to either REV or CON divided by the mean firing rate in response to BOS. A value of 1 indicates an equally strong response to both stimuli. Values <1 indicate a stronger response to BOS, whereas values >1 indicate a stronger response to the stimulus being compared. Data for HVc are the same as those published in Figure 3b of Margoliash et al. (1994). The number of units contributing to each histogram is indicated in the top right corner of each plot. In the case of CON/BOS, multiple exemplars of CON may have been presented while recording any given unit. Thus, each entry in the histogram reflects that average response to CON for each unit.
Fig. 4.
Fig. 4.
Song selectivity of NIf and L1 neurons as measured using an index of discriminability, d′ (see Materials and Methods). The left panels depict comparisons of REV and BOS responses, and the right panels show comparisons of CON and BOS responses. A d′ value of zero indicates no difference between responses to the two stimuli, whereas a positived′ value indicates a stronger response to BOS. The distributions for L1 neurons are centered around zero but are shifted to more positive values for both REV and CON in the case of NIf neurons, indicating selectivity of NIf but not L1 neurons to BOS.
Fig. 5.
Fig. 5.
Correlated firing in NIf and HVc ongoing activity.A, Thirty seconds of simultaneously recorded ongoing multiunit activity in NIf and HVc. Note the appearance of correlated bursts of activity. B, A closer view of a 6 sec excerpt from A. C, A 150 msec detail of the correlated burst on the right in B. The HVc activity lags slightly behind the NIf activity.
Fig. 6.
Fig. 6.
Cross-correlograms of single-unit activity in NIf or L1 and multiunit activity in HVc. In each panel, thethin line indicates the measured cross-correlation, and the thick line indicates the shuffled cross-correlation that results from cross-correlating epochs of activity recorded at different times on each channel (see Materials and Methods). For each unit in each bird, the top panel of each pair of panels shows the cross-correlation in the ongoing activity in the 1 sec epochs preceding stimuli. The bottom panel shows the cross-correlation in the activity recorded during playback of BOS. The peaks in the shuffled cross-correlograms computed for BOS playback epochs indicate constant timing relationships between activity on the two channels across multiple presentations of BOS. Negative values of τ indicate that HVc activity leads either the NIf or L1 activity.
Fig. 7.
Fig. 7.
Summary of cross-correlations observed between NIf or L1 single units and HVc activity. Each row in apanel corresponds to the cross-correlogram for one unit. Within each row, a vertical bandindicates that the cross-correlation value at that particular τ was significantly greater in the cross-correlogram of the observed activity than in the shuffled activity cross-correlogram (see Materials and Methods). Darker shades of gray indicate a more highly statistically significant result (lower pvalue). The values on the color bar range fromp = 0 to the Bonferroni-corrected significance criterion cutoff value of p = 0.0005. Theasterisks in the top left panel markrows that represent cross-correlograms between NIf single units and HVc single units. For NIf, units numbers 7 and 12 correspond to cross-correlograms shown in Figure 6 for zf_bl411 and zf_bl417, respectively. For L1, units numbers 3 and 4 correspond to zf_bl405 and zf_bl411, respectively.

References

    1. Bedenbaugh P, Gerstein GL. Multiunit normalized cross correlation differs from the average single-unit normalized correlation. Neural Comput. 1997;9:1265–1275. - PubMed
    1. Boughman JW. Vocal learning by greater spear-nosed bats. Proc R Soc Lond B Biol Sci. 1998;265:227–233. - PMC - PubMed
    1. Capsius B, Leppelsack HJ. Influence of urethane anesthesia on neural processing in the auditory cortex analogue of a songbird. Hear Res. 1996;96:59–70. - PubMed
    1. Doupe AJ, Konishi M. Song-selective auditory circuits in the vocal control system of the zebra finch. Proc Natl Acad Sci USA. 1991;88:11339–11343. - PMC - PubMed
    1. Eales LA. Song learning in zebra finches: some effects of song model availability on what is learnt and when. Anim Behav. 1985;33:1293–1300.

Publication types

LinkOut - more resources