

Std1 and Mth1 proteins interact with the glucose sensors to control glucose-regulated gene expression in Saccharomyces cerevisiae
- PMID: 10373505
- PMCID: PMC84254
- DOI: 10.1128/MCB.19.7.4561
Std1 and Mth1 proteins interact with the glucose sensors to control glucose-regulated gene expression in Saccharomyces cerevisiae
Abstract
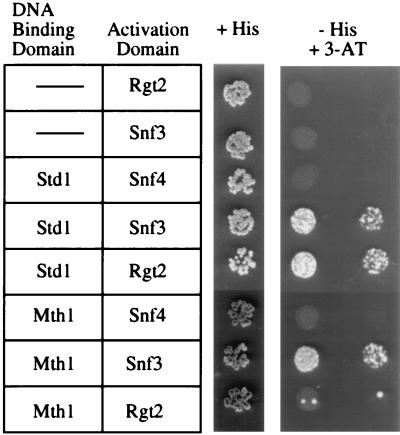
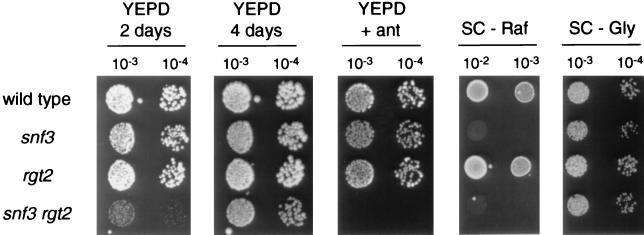
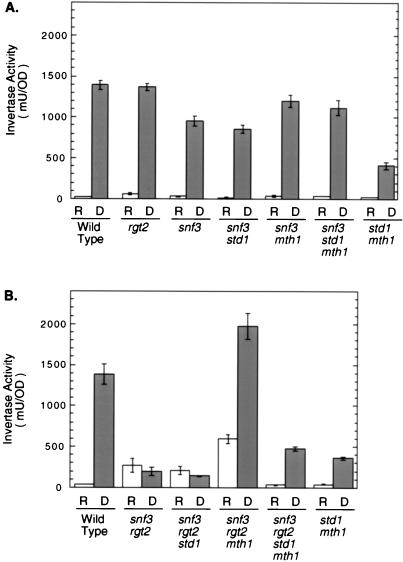
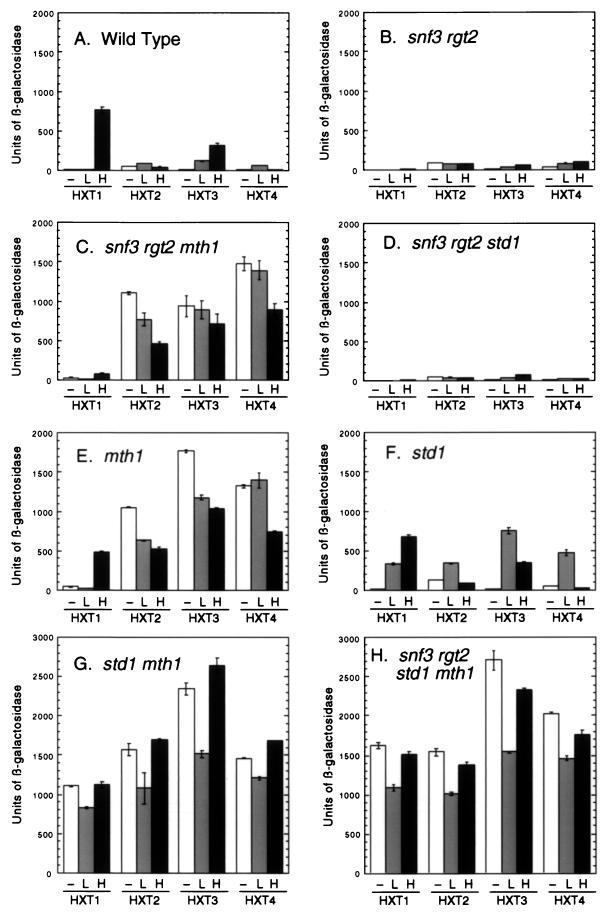
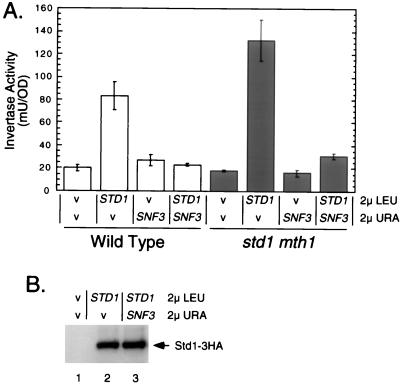
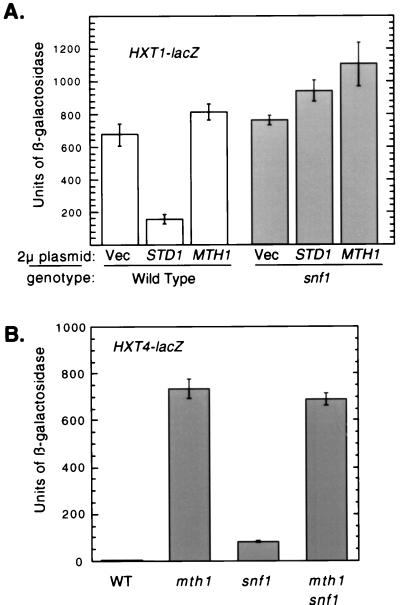
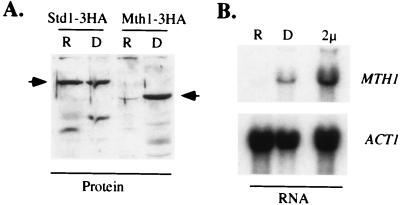
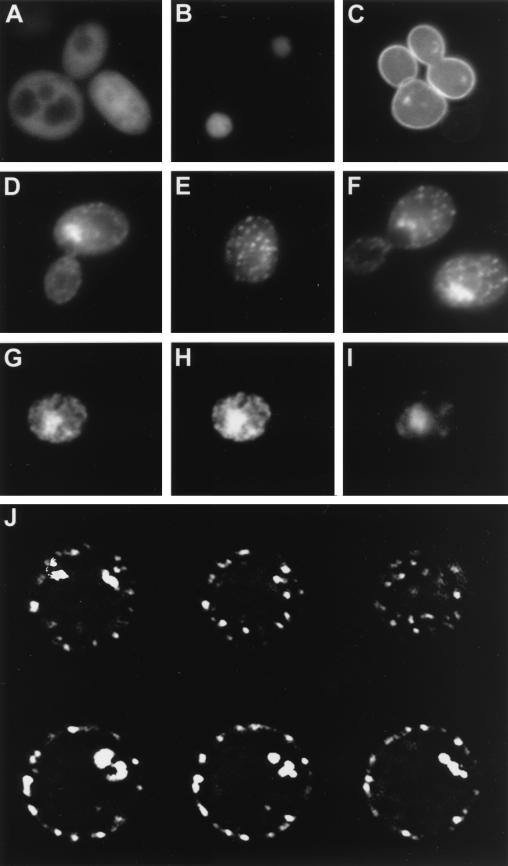
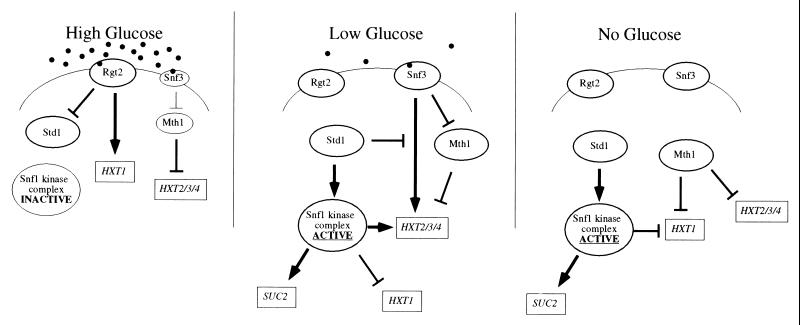
The Std1 protein modulates the expression of glucose-regulated genes, but its exact molecular role in this process is unclear. A two-hybrid screen for Std1-interacting proteins identified the hydrophilic C-terminal domains of the glucose sensors, Snf3 and Rgt2. The homologue of Std1, Mth1, behaves differently from Std1 in this assay by interacting with Snf3 but not Rgt2. Genetic interactions between STD1, MTH1, SNF3, and RGT2 suggest that the glucose signaling is mediated, at least in part, through interactions of the products of these four genes. Mutations in MTH1 can suppress the raffinose growth defect of a snf3 mutant as well as the glucose fermentation defect present in cells lacking both glucose sensors (snf3 rgt2). Genetic suppression by mutations in MTH1 is likely to be due to the increased and unregulated expression of hexose transporter genes. In media lacking glucose or with low levels of glucose, the hexose transporter genes are subject to repression by a mechanism that requires the Std1 and Mth1 proteins. An additional mechanism for glucose sensing must exist since a strain lacking all four genes (snf3 rgt2 std1 mth1) is still able to regulate SUC2 gene expression in response to changes in glucose concentration. Finally, studies with green fluorescent protein fusions indicate that Std1 is localized to the cell periphery and the cell nucleus, supporting the idea that it may transduce signals from the plasma membrane to the nucleus.
Figures

Similar articles
-
Integration of transcriptional and posttranslational regulation in a glucose signal transduction pathway in Saccharomyces cerevisiae.Eukaryot Cell. 2006 Jan;5(1):167-73. doi: 10.1128/EC.5.1.167-173.2006. Eukaryot Cell. 2006. PMID: 16400179 Free PMC article.
-
Mth1 receives the signal given by the glucose sensors Snf3 and Rgt2 in Saccharomyces cerevisiae.Mol Microbiol. 2000 Jan;35(1):161-72. doi: 10.1046/j.1365-2958.2000.01688.x. Mol Microbiol. 2000. PMID: 10632886
-
The HTR1 gene is a dominant negative mutant allele of MTH1 and blocks Snf3- and Rgt2-dependent glucose signaling in yeast.J Bacteriol. 2000 Jan;182(2):540-2. doi: 10.1128/JB.182.2.540-542.2000. J Bacteriol. 2000. PMID: 10629208 Free PMC article.
-
How do yeast cells sense glucose?Bioessays. 1998 Dec;20(12):972-6. doi: 10.1002/(SICI)1521-1878(199812)20:12<972::AID-BIES2>3.0.CO;2-M. Bioessays. 1998. PMID: 10048296 Review.
-
Glucose repression in Saccharomyces cerevisiae.FEMS Yeast Res. 2015 Sep;15(6):fov068. doi: 10.1093/femsyr/fov068. Epub 2015 Jul 22. FEMS Yeast Res. 2015. PMID: 26205245 Free PMC article. Review.
Cited by
-
Active Snf1 protein kinase inhibits expression of the Saccharomyces cerevisiae HXT1 glucose transporter gene.Biochem J. 2002 Dec 1;368(Pt 2):657-63. doi: 10.1042/BJ20020984. Biochem J. 2002. PMID: 12220226 Free PMC article.
-
Role of casein kinase 1 in the glucose sensor-mediated signaling pathway in yeast.BMC Cell Biol. 2010 Mar 7;11:17. doi: 10.1186/1471-2121-11-17. BMC Cell Biol. 2010. PMID: 20205947 Free PMC article.
-
Grr1p is required for transcriptional induction of amino acid permease genes and proper transcriptional regulation of genes in carbon metabolism of Saccharomyces cerevisiae.Curr Genet. 2005 Mar;47(3):139-49. doi: 10.1007/s00294-004-0553-1. Epub 2004 Dec 21. Curr Genet. 2005. PMID: 15611869
-
Genome-wide analysis of differentially expressed genes from Penicillium chrysogenum grown with a repressing or a non-repressing carbon source.Curr Genet. 2006 Feb;49(2):85-96. doi: 10.1007/s00294-005-0029-y. Epub 2005 Dec 16. Curr Genet. 2006. PMID: 16362424
-
Yeast phospholipase C is required for stability of casein kinase I Yck2p and expression of hexose transporters.FEMS Microbiol Lett. 2017 Dec 1;364(22):fnx227. doi: 10.1093/femsle/fnx227. FEMS Microbiol Lett. 2017. PMID: 29087456 Free PMC article.
References
-
- Ausubel A M, Brent R, Kingston R E, Moore D D, Seidman J G, Smith J A, Struhl K, editors. Current protocols in molecular biology. New York, N.Y: John Wiley & Sons; 1987.
-
- Baldwin S A, Henderson P J F. Homologies between sugar transporters from eukaryotes and prokaryotes. Annu Rev Physiol. 1989;51:459–471. - PubMed
-
- Bartel P L, Chien C, Sternglanz R, Fields S, editors. Using the two-hybrid system to detect protein-protein interactions. Oxford, England: Oxford University Press; 1993.
-
- Becker J U, Betz A. Membrane transport as controlling pacemaker of glycolysis in Saccharomyces carlsbergensis. Biochim Biophys Acta. 1972;274:584–597. - PubMed
Publication types
MeSH terms
Substances
Grants and funding
LinkOut - more resources
Full Text Sources
Other Literature Sources
Molecular Biology Databases