. 1999 Jul;19(7):4664-71.
doi: 10.1128/MCB.19.7.4664.

A RAG1 and RAG2 tetramer complex is active in cleavage in V(D)J recombination

Affiliations

A RAG1 and RAG2 tetramer complex is active in cleavage in V(D)J recombination

T Bailin et al. Mol Cell Biol. 1999 Jul.

Abstract

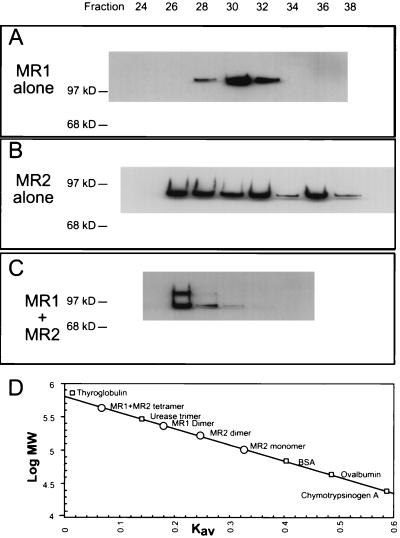
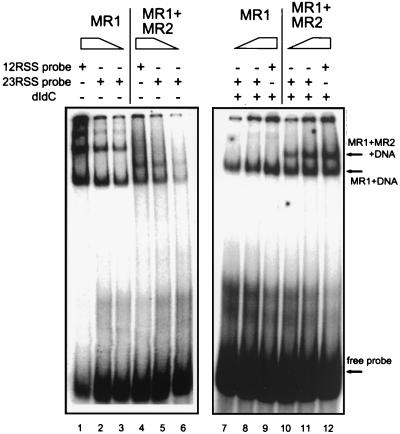
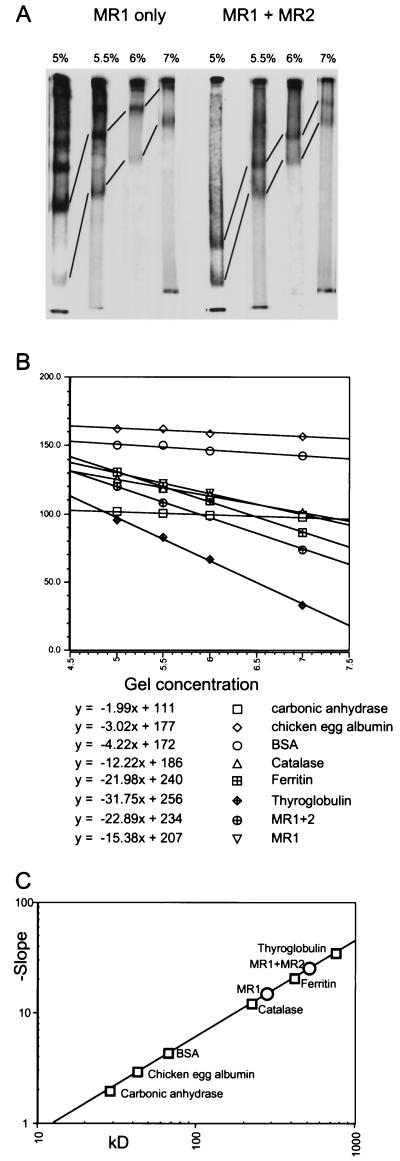
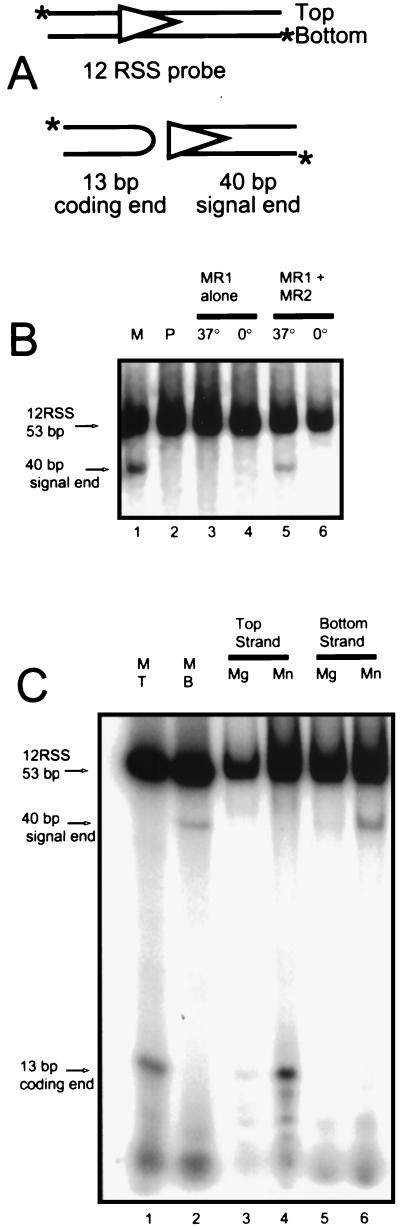
During V(D)J recombination two proteins, RAG1 and RAG2, assemble as a protein-DNA complex with the appropriate DNA targets containing recombination signal sequences (RSSs). The properties of this complex require a fairly elaborate set of protein-protein and protein-DNA contacts. Here we show that a purified derivative of RAG1, without DNA, exists predominantly as a homodimer. A RAG2 derivative alone has monomer, dimer, and larger forms. The coexpressed RAG1 and RAG2 proteins form a mixed tetramer in solution which contains two molecules of each protein. The same tetramer of RAG1 and RAG2 plus one DNA molecule is the form active in cleavage. Additionally, we show that both DNA products following cleavage can still be held together in a stable protein-DNA complex.


Figures

FIG. 1
FIG. 1
Gel filtration analysis of RAG proteins. (A to C) Western blots of alternate fractions collected by chromatography over Superdex 200 resin. (A) Purified MR1 (120-kDa monomer) shows a single peak. (B) Purified MR2 (92-kDa monomer) shows peaks in fractions 32 and 36 and additional higher forms. (C) Coexpressed and purified complex of MR1 plus MR2 shows a single peak which contains both proteins. (D) Calibration curve for protein standards (squares) and location of chromatogram peaks (circles). BSA, bovine serum albumin.
FIG. 2
FIG. 2
EMSA analysis of protein binding to DNA. The two probes 12RSS (lanes 1, 4, 9, and 12) and 23RSS (lanes 2, 3, 5 to 8, 10, and 11) show equivalent behavior. MR1 alone or coexpressed MR1 and MR2 are bound in the absence (lanes 1 to 6) or presence (lanes 7 to 12) of competitor dI-dC. Protein binding to the 23RSS was performed at two concentrations. MR1 alone in the absence of dI-dC forms multiple bands. One band (marked) is unique to lanes that contain MR1 plus MR2.
FIG. 3
FIG. 3
Ferguson plot analysis of RAG protein-DNA complexes. (A) Isolated lanes from EMSA gels show the change in mobility of the native protein-DNA complexes in gels that differ solely in acrylamide concentration (indicated). Bands that represent the same complex under different gel conditions are linked by lines. Binding reactions were assembled in the absence of dI-dC competitor. The mathematical treatment of migration normalizes each lane to the migration of the dye front, thereby correcting for slight differences in runs between gels. (B) Calculation of the characteristic slopes. Migration data as in panel A for the standard proteins and selected experimental bands are plotted as a function of gel concentration. The y axis shows mobility calculated according to the formula y = 100 [log (Rf ∗ 100)]. The relationship between migration and gel concentration is exponential, so the semilog plot yields a line. Rf represents the absolute migration divided by the migration of the dye front for that gel. Each line is described by the formula y = mx + b, where m is the slope. BSA, bovine serum albumin. (C) Ferguson plot. The inverse of the slope is directly proportional to the molecular radius of the particle, which in turn is directly proportional to mass for globular particles. Standards (squares) are plotted, and experimental samples (circles) are interpreted from the resulting standard curve.
FIG. 4
FIG. 4
Cleavage assay applied to gel-purified bands. (A) Schematic representation of the two probes used for the assay. The 12RSS probe is represented by the triangle, with cleavage occurring at the heptamer border (vertical side) to produce the hairpinned coding end (13 bp) and signal end (40 bp). Only one of these products will be labeled, depending on which DNA strand is 5′-end labeled initially (asterisk). (B) Complexes assembled on ice in Mn2+ with both MR1 and MR2 were separated on a native gel, and the two bands were excised and incubated at the indicated temperature. The DNA was recovered and run in a second gel in TBE buffer. Lane M, marker of the cleavage reaction performed in solution; lane P, the unreacted probe. The excised band known to contain only the MR1 protein does not exhibit cleavage activity (lanes 3 and 4), but the excised band which contains both MR1 and MR2 (lanes 5 and 6) cleaves its DNA when incubated at 37°C. (C) Cleavage of probe in the excised MR1-MR2 band occurs only in Mn2+. Parallel reactions were assembled in Mg2+ and Mn2+ with 12RSS probes labeled individually on the top (T) or bottom (B) strand. A native gel was run, and the complexes containing MR1 plus MR2 were excised and then incubated in their original reaction buffer. The DNA was recovered and run in a gel in TBE buffer. Lanes 1 and 2 are cleavage reactions in solution for probes labeled on the top or bottom strand as markers. Activity on the probe labeled on the top (lanes 3 and 4) and bottom (lanes 5 and 6) strands is much stronger in the presence of Mn2+ than Mg2+.
FIG. 5
FIG. 5
Retention of both signal ends and coding ends in the MR1-MR2 complex. The same two probes used for Fig. 4 were assembled into cleavage reactions and incubated at 37°C. Complexes were separated in a native gel, and bands corresponding to MR1-MR2 complex (lanes 2 and 5) or the MR1-alone complex (lanes 3 and 6) were excised. DNA was recovered and run in a TBE gel. Lanes 1 and 4 are cleavage reactions in solution for probes labeled on the bottom or top strand as markers.

Similar articles

Cited by

References

    1. Akamatsu Y, Oettinger M A. Distinct roles of RAG1 and RAG2 in binding the V(D)J recombination signal sequences. Mol Cell Biol. 1998;18:4670–4678. - PMC - PubMed
    1. Besmer E, Mansilla-Soto J, Cassard S, Sawchuk D J, Brown G, Sadofsky M, Lewis S M, Nussenzweig M C, Cortes P. Hairpin coding end opening is mediated by RAG1 and RAG2 proteins. Mol Cell. 1998;2:817–828. - PubMed
    1. Bullock B P, Habener J F. Phosphorylation of the cAMP response element binding protein CREB by cAMP-dependent protein kinase A and glycogen synthase kinase-3 alters DNA-binding affinity, conformation, and increases net charge. Biochemistry. 1998;37:3795–3809. - PubMed
    1. Difilippantonio M J, McMahan C J, Eastman Q M, Spanopoulou E, Schatz D G. RAG1 mediates signal sequence recognition and recruitment of RAG2 in V(D)J recombination. Cell. 1996;87:253–262. - PubMed
    1. Eastman Q M, Leu T M J, Schatz D G. Initiation of V(D)J recombination in-vitro obeying the 12/23-rule. Nature. 1996;380:85–88. - PubMed

Publication types

LinkOut - more resources