. 1999 Jul;19(7):4953-60.
doi: 10.1128/MCB.19.7.4953.

Transcriptional activity and chromatin structure of enhancer-deleted rRNA genes in Saccharomyces cerevisiae

Affiliations

Transcriptional activity and chromatin structure of enhancer-deleted rRNA genes in Saccharomyces cerevisiae

M Banditt et al. Mol Cell Biol. 1999 Jul.

Abstract

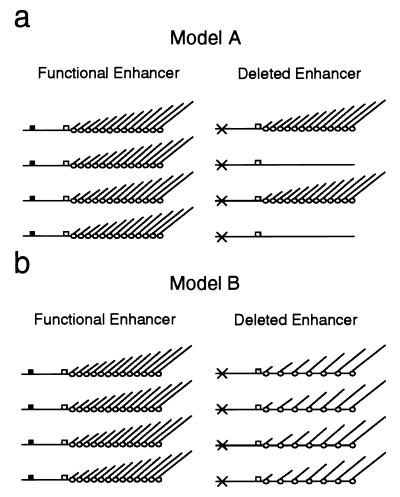
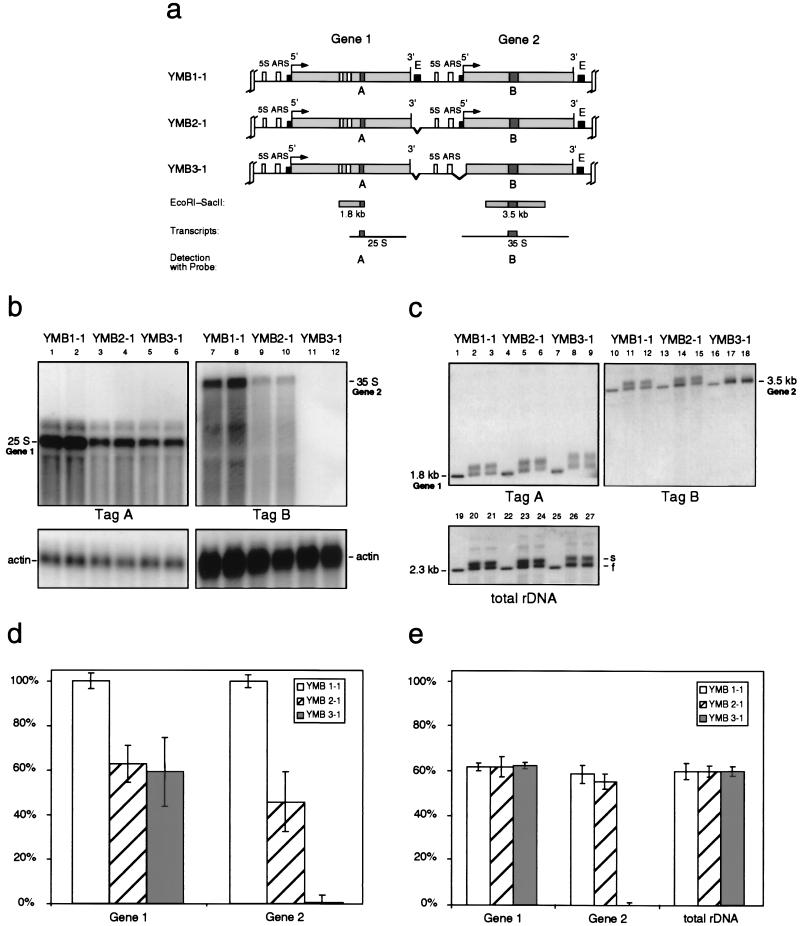
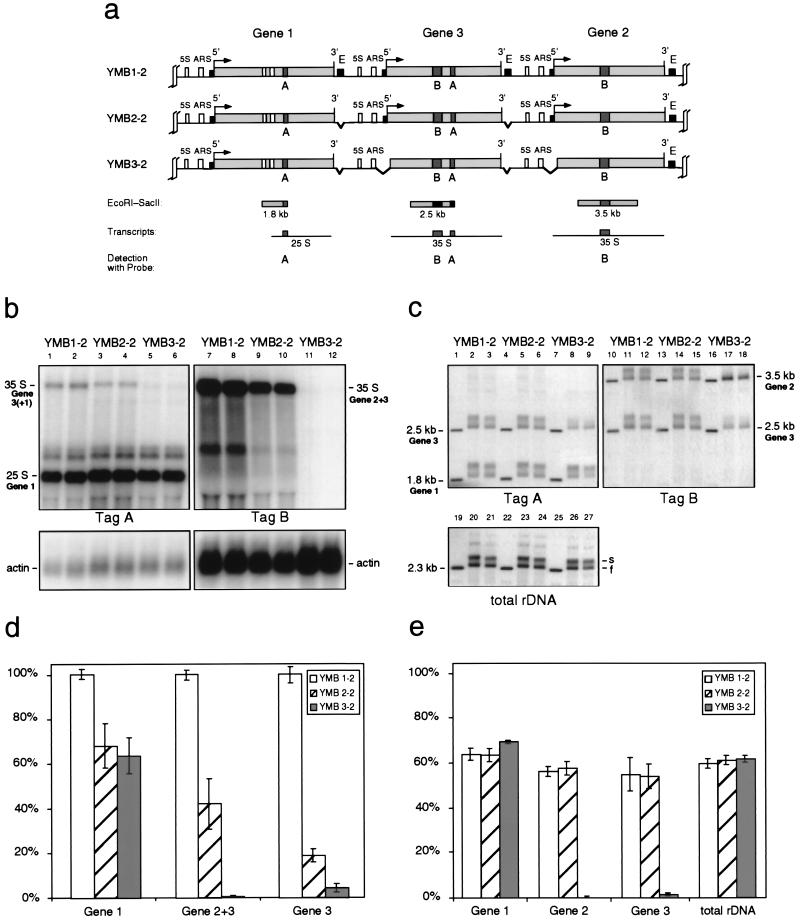
We used the psoralen gel retardation assay and Northern blot analysis in an in vivo yeast system to analyze effects of rDNA enhancer deletions on the chromatin structure and the transcription of tagged rDNA units. We found that upon deletion of a single enhancer element, transcription of the upstream and downstream rRNA gene was reduced by about 50%. Although removing both flanking enhancers of an rRNA gene led to a further reduction in transcription levels, a significant amount of transcriptional activity remained, either resulting from the influence of more distantly located enhancer elements or reflecting the basal activity of the polymerase I promoter within the nucleolus. Despite the reduction of transcriptional activity upon enhancer deletion, the activation frequency (proportion of nonnucleosomal to nucleosomal gene copies in a given cell culture) of the tagged rRNA genes was not significantly altered, as determined by the psoralen gel retardation assay. This is a strong indication that, within the nucleolus, the yeast rDNA enhancer functions by increasing transcription rates of active rRNA genes and not by activating silent transcription units.


Figures

FIG. 1
FIG. 1
Models of rDNA enhancer action. (a) An enhancer could work by increasing the chance that an adjacent promoter is activated for transcription. In this case, deletion of the enhancer element would result in fewer genes being transcribed. (b) Alternatively, the enhancer might raise the polymerase initiation rate of active genes. Deletion of the enhancer would thus result in the same number of active genes transcribed by fewer polymerases. Black boxes denote enhancers, white boxes denote promoters, and crosses indicate deleted enhancer elements. Polymerases with nascent transcripts are depicted as empty circles.
FIG. 2
FIG. 2
Construction of yeast strains carrying tagged rRNA transcription units (YMB1-1 to YMB3-2). A 9.1-kb MluI-MluI fragment from the rDNA locus of S. cerevisiae SC3 was cloned into a pUC18-derived plasmid. Two short tag sequences were inserted at the sites indicated, and the resulting construct was reintegrated into the rDNA locus by homologous recombination (for details, see Materials and Methods).
FIG. 3
FIG. 3
Analysis of single-integration clones. (a) Map showing the two tagged rRNA transcription units (genes 1 and 2) obtained by a single-integration event of the constructs into the rDNA locus, yielding yeast variants YMB1-1 to YMB3-1. The transcription initiation site (5′) and the 3′ end of the 35S genes are indicated. The small filled boxes near the 5′ and 3′ ends correspond to the promoter and enhancer (E) elements, respectively. The 5S genes and the autonomous replicating sequences (ARS) located in the intergenic spacers are also shown. Restriction fragments containing the SV40 sequence tags A and B are shown as well as the expected pol I transcripts. (b) Northern blot analysis of the RNA levels of the tagged genes. RNA was extracted, purified, and separated on a 0.8% formaldehyde gel. The gel was blotted and hybridized against the sequence tags A or B as indicated. The blots were then stripped and hybridized to an actin probe as a loading control. The results from two independent clones of each yeast strain are shown. (c) Psoralen gel retardation analysis of the indicated restriction fragments. Yeast cells growing exponentially in complex medium were photoreacted with psoralen. The purified DNA (extracted simultaneously with the RNA preparation for the Northern blot analysis) was digested with EcoRI and SacII, separated on a 1.2% agarose gel, and visualized after blotting by hybridization with the sequence tags A or B as indicated. The blots were then stripped and hybridized as a control to a probe complementary to the 25S gene (total rDNA) (for details, see the work of Dammann et al. [5]). The results from two independent clones of each yeast strain are shown. (d) Statistical analysis of the data obtained from three Northern blot assays. All signals were corrected for loading by using the actin band as a standard. Signal strengths from strain YMB1-1 were defined as 100%. (e) Statistical analysis of the percentage of low-migrating bands (s bands, representing the nonnucleosomal, active gene fraction) from data obtained from three psoralen gel retardation assays. (d and e) Error bars, standard errors of the means.
FIG. 4
FIG. 4
Analysis of double-integration clones. (a) Map showing the three tagged rRNA transcription units (gene 1 to 3) obtained by a double-integration event of the constructs into the rDNA locus, yielding yeast variants YMB1-2 to YMB3-2. See the legend to Fig. 3a for an explanation of abbreviations. (b) Northern blot analysis of the RNA levels of the tagged genes. Results from two independent clones of each yeast strain are shown. (c) Psoralen gel retardation analysis of the indicated restriction fragments. Two independent clones of each yeast strain are shown. (d) Statistical analysis of the data obtained from three Northern blot assays. All signals were corrected for loading by using the actin band as a standard. Signal strengths from strain YMB1-2 were defined as 100%. Note that tag B yields a composite signal derived from genes 2 and 3. (e) Statistical analysis of the percentage of slow-migrating bands (s bands, representing the nonnucleosomal, active gene fraction) from data obtained from three psoralen gel retardation assays. (d and e) Error bars, standard errors of the means.

References

    1. Banditt M. Ph.D. thesis no. 12874. Zürich, Switzerland: Eidgenössische Technische Hochschule Zürich; 1998.
    1. Becker D M, Guarente L. High-efficiency transformation of yeast by electroporation. Methods Enzymol. 1991;194:182–187. - PubMed
    1. Brewer B J, Fangman W L. A replication fork barrier at the 3′ end of yeast ribosomal RNA genes. Cell. 1988;55:637–643. - PubMed
    1. Butlin M, Quincey R. The yeast rRNA gene enhancer does not function by recycling RNA polymerase I and cannot act as a UAS. Curr Genet. 1991;20:9–16. - PubMed
    1. Conconi A, Widmer R M, Koller T, Sogo J M. Two different chromatin structures coexist in ribosomal RNA genes throughout the cell cycle. Cell. 1989;57:753–761. - PubMed

Publication types

LinkOut - more resources