. 1999 Jul;19(7):5025-35.
doi: 10.1128/MCB.19.7.5025.

Disordered T-cell development and T-cell malignancies in SCL LMO1 double-transgenic mice: parallels with E2A-deficient mice

Affiliations

Disordered T-cell development and T-cell malignancies in SCL LMO1 double-transgenic mice: parallels with E2A-deficient mice

D S Chervinsky et al. Mol Cell Biol. 1999 Jul.

Abstract

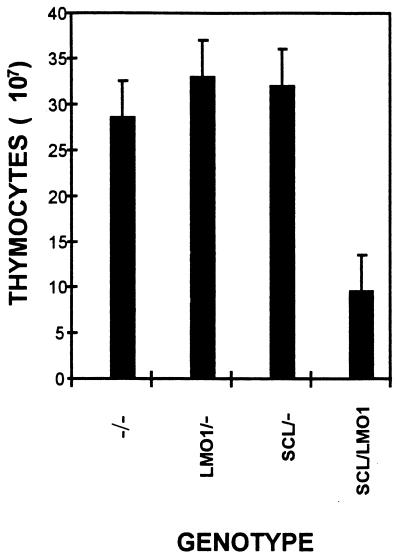
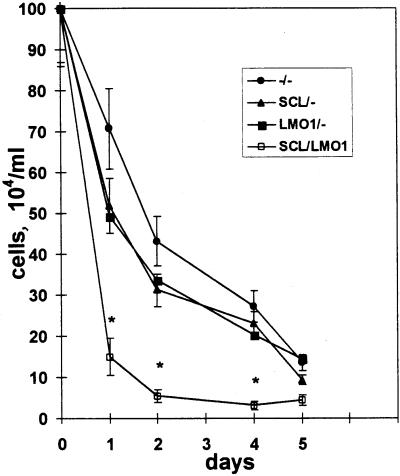
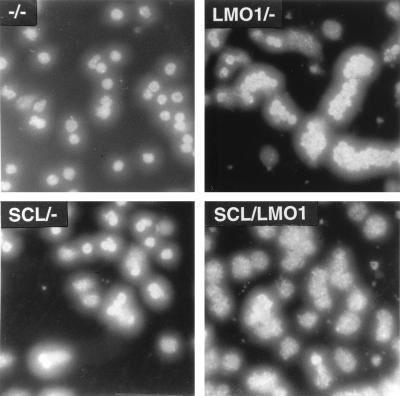
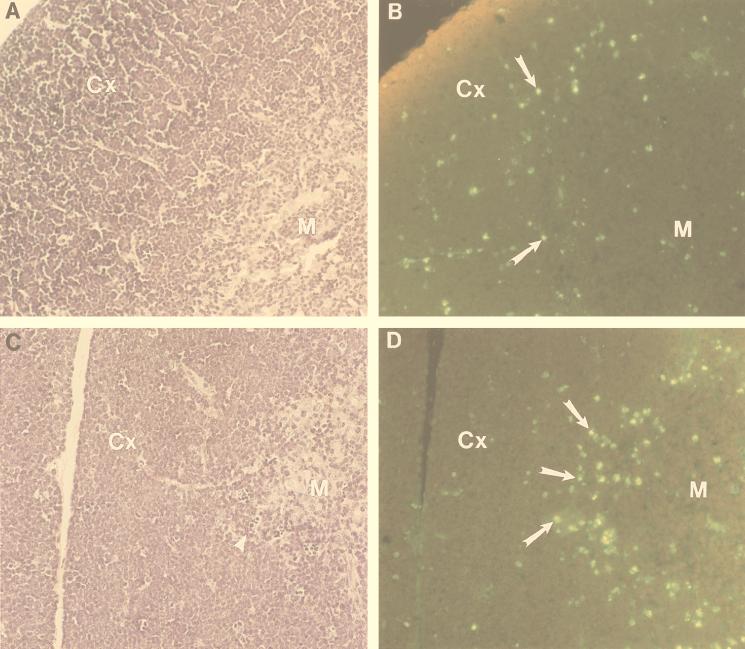
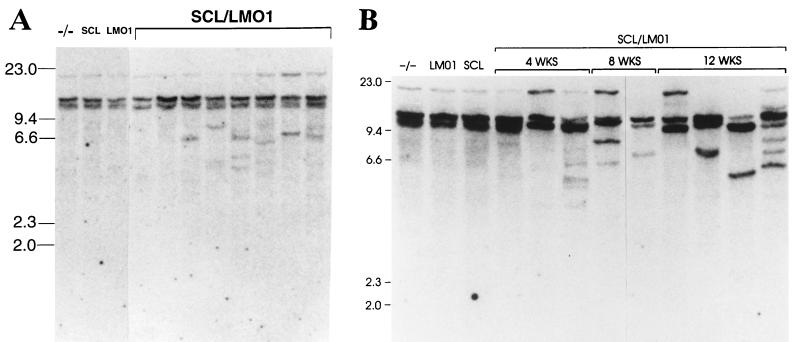
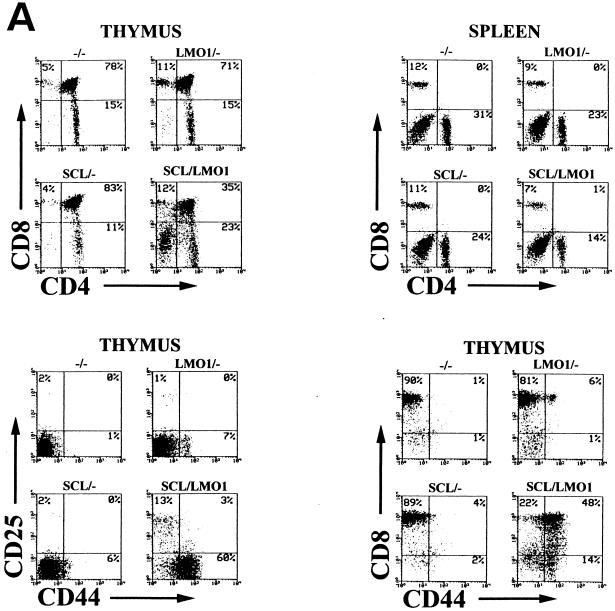
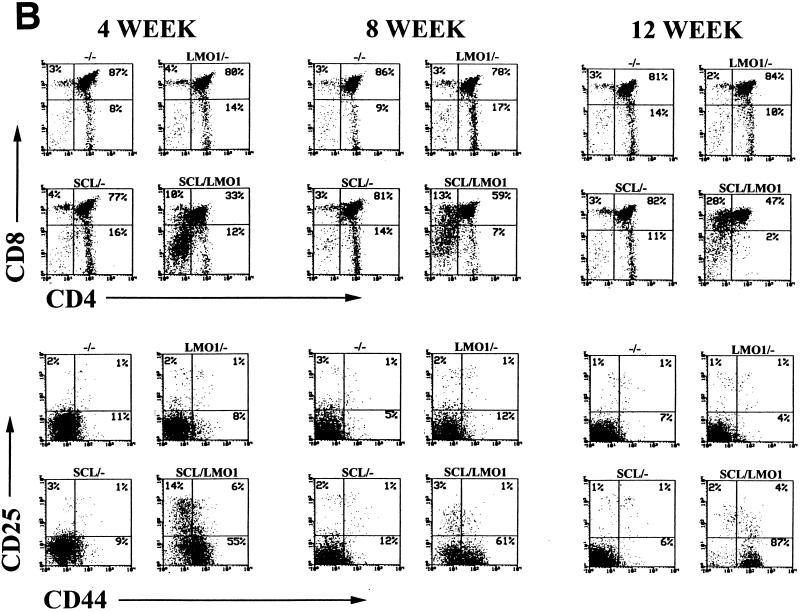
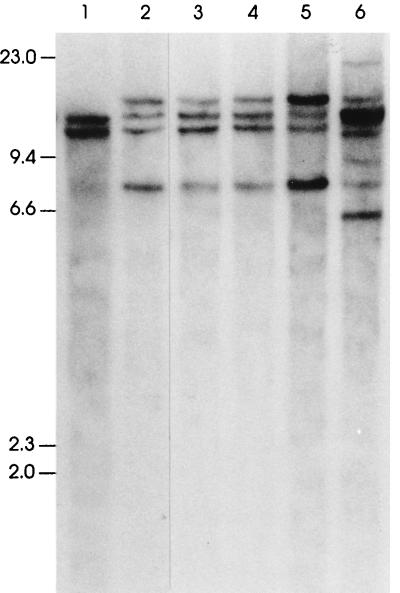
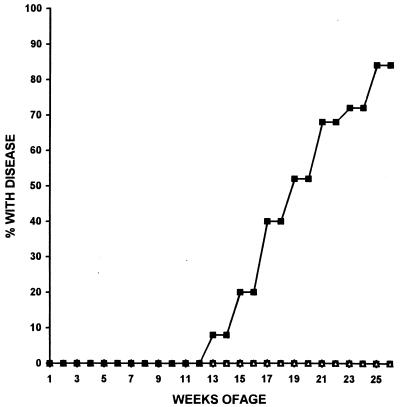
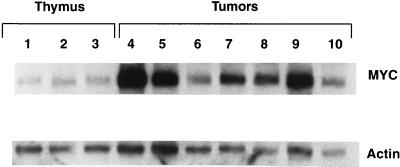
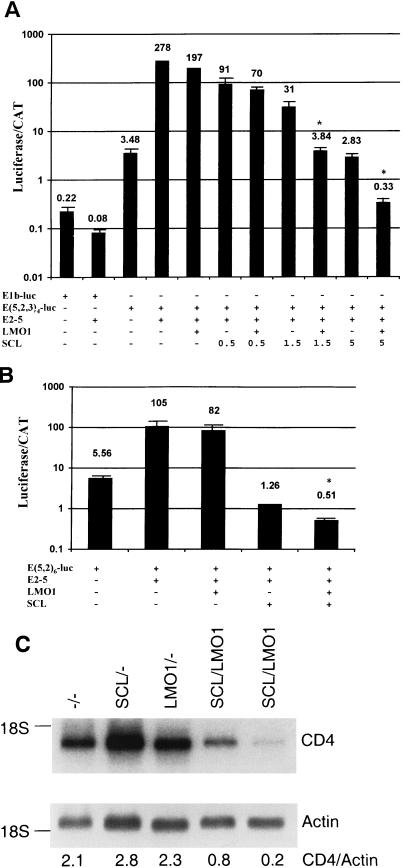
The gene most commonly activated by chromosomal rearrangements in patients with T-cell acute lymphoblastic leukemia (T-ALL) is SCL/tal. In collaboration with LMO1 or LMO2, the thymic expression of SCL/tal leads to T-ALL at a young age with a high degree of penetrance in transgenic mice. We now show that SCL LMO1 double-transgenic mice display thymocyte developmental abnormalities in terms of proliferation, apoptosis, clonality, and immunophenotype prior to the onset of a frank malignancy. At 4 weeks of age, thymocytes from SCL LMO1 mice show 70% fewer total thymocytes, with increased rates of both proliferation and apoptosis, than control thymocytes. At this age, a clonal population of thymocytes begins to populate the thymus, as evidenced by oligoclonal T-cell-receptor gene rearrangements. Also, there is a dramatic increase in immature CD44(+) CD25(-) cells, a decrease in the more mature CD4(+) CD8(+) cells, and development of an abnormal CD44(+) CD8(+) population. An identical pattern of premalignant changes is seen with either a full-length SCL protein or an amino-terminal truncated protein which lacks the SCL transactivation domain, demonstrating that the amino-terminal portion of SCL is not important for leukemogenesis. Lastly, we show that the T-ALL which develop in the SCL LMO1 mice are strikingly similar to those which develop in E2A null mice, supporting the hypothesis that SCL exerts its oncogenic action through a functional inactivation of E proteins.


Figures

FIG. 1
FIG. 1
Decreased number of thymocytes in SCL LMO1 transgenic mice. Littermates were sacrificed at 4 to 5 weeks of age, and the total number of thymocytes was counted. The numbers reflect the mean ± the standard deviation of 12 to 18 mice for each genotype.
FIG. 2
FIG. 2
SCL LMO1 thymocytes show decreased viability. (Top) Thymocyte survival in vitro. Thymocytes from 4-week-old mice (n = 4 for −/−, SCL/−, and LMO1/−; n = 8 for SCL LMO1) were placed in culture, and viable cells were counted daily. Genotypes are as indicated. The values shown reflect the mean ± the standard deviation; the asterisks indicate a significant difference (P < 0.005) between SCL LMO1 and the other genotypes. (Bottom) Increased apoptosis in thymocytes from SCL LMO1 transgenic mice. Thymocytes cultured in vitro for 24 h were stained with Hoechst 33258; apoptosis is indicated by increased nuclear fragmentation in the SCL LMO1 transgenic mice.
FIG. 2
FIG. 2
SCL LMO1 thymocytes show decreased viability. (Top) Thymocyte survival in vitro. Thymocytes from 4-week-old mice (n = 4 for −/−, SCL/−, and LMO1/−; n = 8 for SCL LMO1) were placed in culture, and viable cells were counted daily. Genotypes are as indicated. The values shown reflect the mean ± the standard deviation; the asterisks indicate a significant difference (P < 0.005) between SCL LMO1 and the other genotypes. (Bottom) Increased apoptosis in thymocytes from SCL LMO1 transgenic mice. Thymocytes cultured in vitro for 24 h were stained with Hoechst 33258; apoptosis is indicated by increased nuclear fragmentation in the SCL LMO1 transgenic mice.
FIG. 3
FIG. 3
Increased apoptosis at the corticomedullary junction in thymi from SCL LMO1 transgenic mice. Hematoxylin-eosin-stained sections from nontransgenic (A) and double-transgenic (C) mouse thymus are shown. Serial sections from nontransgenic (B) and double-transgenic (D) mice were stained for apoptotic cells. M, medulla; Cx, cortex. Apoptotic cells are indicated with arrows in panels B and D, and an arrowhead in panel C demonstrates several small, pyknotic cells at the corticomedullary junction. An increased number of apoptotic cells outlining the medulla is seen in panel D.
FIG. 4
FIG. 4
Emergence of clonal populations in SCL LMO1 transgenic mice. (A) Total thymocytes from 4-week-old mice analyzed by Southern blot hybridization to a TCR Cβ2 probe. Genotypes are as indicated, and size standards are in kilobases. Some but not all of the SCL LMO1 mice in this experiment show discrete rearranged fragments, reflecting marked clonal expansion. (B) The clonal populations become more pronounced with age. Total thymocytes from mice at 4, 8, or 12 weeks of age were analyzed by Southern blot hybridization to a TCR Cβ2 probe. Increasing prominence of one or several clonal rearranged fragments is seen at 8 and 12 weeks compared to 4 weeks.
FIG. 5
FIG. 5
Aberrant T-cell development reflected by immunophenotype. (A) Total thymocytes or splenocytes from 4-week-old mice stained with the indicated antibodies. The percent positivity and genotype are as indicated. Distinct, abnormal populations are seen in the SCL LMO1 transgenic mice (see the text). (B) Evolution of abnormal thymocyte populations with time. Total thymocytes from mice at 4, 8, or 12 weeks of age were stained with the indicated antibodies and analyzed as described in the text.
FIG. 5
FIG. 5
Aberrant T-cell development reflected by immunophenotype. (A) Total thymocytes or splenocytes from 4-week-old mice stained with the indicated antibodies. The percent positivity and genotype are as indicated. Distinct, abnormal populations are seen in the SCL LMO1 transgenic mice (see the text). (B) Evolution of abnormal thymocyte populations with time. Total thymocytes from mice at 4, 8, or 12 weeks of age were stained with the indicated antibodies and analyzed as described in the text.
FIG. 6
FIG. 6
A single clone emerges from an abnormal, oligoclonal population. Total thymocytes from a 12-week-old SCL LMO1 transgenic mouse were injected into a nude mouse. SstI-digested genomic DNA from nude mouse tail (lane 1) and resultant tumor masses (lanes 2 to 5 reflecting four discrete axillary, inguinal, and mediastinal lymph nodes) as well as the original thymocytes injected (lane 6) were analyzed for clonal TCRβ gene rearrangements as described in the legend to Fig. 4. Six rearranged fragments representing three to six independent clones are seen in the original thymocyte sample; only two rearranged fragments (of 7.5 and 15.0 kb), likely representing a single clone, are seen in the four discrete tumor masses.
FIG. 7
FIG. 7
Cumulative incidence of leukemia/lymphoma in mice transgenic for LMO1 and a full-length SCL. Genotypes are represented as follows: ▵, −/−; ○, SCL/−; □, LMO1/−; and ■, SCL LMO1. The cumulative percentage of SCL LMO1 mice (n = 25) with T-cell leukemia/lymphoma is plotted versus time. None of the nontransgenic controls (n = 23) or littermates positive for only SCL (n = 14) or only LMO1 (n = 17) developed disease during the 6-month study period.
FIG. 8
FIG. 8
c-myc overexpression in SCL LMO1 tumors. Total RNA from three control thymus samples obtained from 4-month-old nontransgenic animals, along with seven tumor samples, was analyzed by Northern blot hybridization to a c-myc probe. An actin hybridization signal was used as a loading control. Various degrees of c-myc overexpression can be detected in all of the samples compared to controls.
FIG. 9
FIG. 9
Cooperative effect of SCL and LMO1 on E-box-mediated transcription. (A) NIH 3T3 cells were transfected with the indicated constructs in triplicate, along with an internal transfection control (pCAT Control; Promega); 5 μg of all expression vectors was used unless otherwise indicated. The values presented are the means ± the standard deviation of relative luciferase units, divided by the counts per minute (CAT activity) to control for transfection efficiency; in some cases, the standard deviation bars are too small to be seen. The data are plotted on a logarithmic scale, and the values for each triplicate are shown above the data bars. An asterisk indicates a significant difference (P < 0.001) between the transfections with SCL alone and those with LMO1 and SCL. The entire experiment was repeated once with similar results. (B) The experiment was performed and the data are presented as described for panel A, except that E(5,2)-luc was used as the reporter vector. (C) Expression of CD4 is decreased in thymocytes from SCL LMO1 mice. Ten micrograms of total RNA were assayed for CD4 expression by Northern blotting; actin was used as a loading control. The genotypes are as indicated, and the ratios of CD4 to actin signals are shown below each lane.

Similar articles

Cited by

References

    1. Aplan P D, Begley C G, Bertness V, Nussmeier M, Ezquerra A, Coligan J, Kirsch I R. The SCL gene is formed from a transcriptionally complex locus. Mol Cell Biol. 1990;10:6426–6435. - PMC - PubMed
    1. Aplan P D, Jones C A, Chervinsky D S, Zhao X, Ellsworth M, Wu C, McGuire E A, Gross K W. An scl gene product lacking the transactivation domain induces bony abnormalities and cooperates with LMO1 to generate T-cell malignancies in transgenic mice. EMBO J. 1997;16:2408–2419. - PMC - PubMed
    1. Aplan P D, Lombardi D P, Ginsberg A M, Cossman J, Bertness V I, Kirsch I R. Disruption of the human SCL locus by “illegitimate” V-(D)-J recombinase activity. Science. 1990;250:1426–1429. - PubMed
    1. Aplan P D, Lombardi D P, Kirsch I R. Structural characterization of SIL, a gene frequently disrupted in T-cell acute lymphoblastic leukemia. Mol Cell Biol. 1991;11:5462–5469. - PMC - PubMed
    1. Bain G, Engel I, Robanus-Maandag E C, te Riele H P, Voland J R, Sharp L I, Chun J, Huey B, Pinkel D, Murre C. E2A deficiency leads to abnormalities in α/β T-cell development and to rapid development of T-cell lymphomas. Mol Cell Biol. 1997;17:4782–4791. - PMC - PubMed

Publication types

MeSH terms