Clinical Trial
. 1999 Jul 1;518(Pt 1):301-14.
doi: 10.1111/j.1469-7793.1999.0301r.x.

Changes in excitability indices of cutaneous afferents produced by ischaemia in human subjects

Affiliations
Clinical Trial

Changes in excitability indices of cutaneous afferents produced by ischaemia in human subjects

J Grosskreutz et al. J Physiol. .

Abstract

1. The present study was undertaken to determine whether mechanisms other than membrane depolarization contribute to the changes in excitability of cutaneous afferents of the median nerve under ischaemic conditions. 2. In six healthy subjects, axonal excitability was measured as the reciprocal of the threshold for a compound sensory action potential (CSAP) of 50% maximal amplitude. Refractoriness and supernormality were measured as threshold changes 2 and 7 ms, respectively, after supramaximal conditioning stimuli. The strength-duration time constant (tauSD) was calculated from the thresholds for unconditioned CSAPs using test stimuli of 0.1 and 1.0 ms duration. Changes in these indices were measured when subthreshold polarizing currents lasting 10 or 100 ms were applied, before, during and after ischaemia for 13 min. 3. At rest, the change in supernormality produced by polarizing currents was greater with the longer polarizing current, indicating that it took up to 100 ms to charge the internodal capacitance. 4. Refractoriness and its dependence on excitability increased more than expected during ischaemia. Supernormality was abolished during ischaemia, and reached a maximum after ischaemia but was then barely altered by polarizing current. tauSD had a similar relationship to excitability before, during and after ischaemia. 5. By contrast, during continuous depolarizing current for 8 min to mimic the depolarization produced by ischaemia, the relationship between excitability and refractoriness was the same during the depolarization as before it. 6. It is suggested that the large increase in refractoriness during ischaemia might be due to interference with the recovery from inactivation of transient sodium channels by an intra-axonal substrate of ischaemia. The post-ischaemic increase in supernormality and the lack of change with changes in axonal excitability can be explained by blockage of voltage-dependent potassium channels.


Figures

Figure 1
Figure 1. Threshold data from an entire experiment
Polarizing steps were begun at 1 min, initially 50% depolarizing, changing to 40% depolarizing at the first vertical arrow. Ischaemia was applied during the period indicated by the horizontal bar, starting at 14 min. Traces a, b and c represent thresholds using a 0.1 ms test pulse, unconditioned (a) and conditioned using conditioning-test intervals of 2 ms (b) and 7 ms (c). Traces d and e are thresholds in response to a 1 ms test pulse, with and without polarization. Polarizing current was applied during traces a-d, the strength of the current being a percentage of the threshold of trace e. Accordingly, trace e shows the (unmodified) threshold changes produced by ischaemia and its release. The double-headed arrow shows the interval over which threshold-dependence relationships were assessed during ischaemia. The open vertical bar indicates the ‘resting’ state during ischaemia, when the polarizing current was zero. Data from one experiment.
Figure 2
Figure 2. Threshold dependence of excitability indices prior to ischaemia
Polarizing steps proceeded from 50% hyperpolarization to 50% depolarization. Traces in A show the original thresholds and are labelled as in Fig. 1. The open vertical bar indicates zero polarization. B illustrates the polarizing current, initially set to 50% of the current in A trace e. C illustrates the excitability indices, calculated from the threshold data in A. ‘Excitability’ is the reciprocal of the unconditioned threshold (i.e. trace a in A). For refractoriness (b) and supernormality (c), the change in threshold is expressed as a fraction (rather than a percentage). τSD (d) is in milliseconds. Data from one experiment.
Figure 4
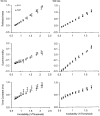
Figure 4. Effects of the duration of the polarizing current and the direction of the step changes on excitability indices
When the polarizing current lasted 100 ms (right panels), the relationships for refractoriness and τSD were the same as those with 10 ms polarizing currents (left panels), but the relationships for supernormality differed significantly (D-H, P = 0.003; H-D, P = 0.001) There were no differences in the relationships whether the polarizing steps started with 50% depolarizing and ended with 50% hyperpolarizing current (D-H, ⋄) or the reverse (H-D, ▴). Data are mean values for six subjects ±s.e.m.
Figure 7
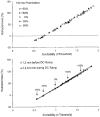
Figure 7. Changes in refractoriness and its relationship to excitability
A and B present the mean data for the six subjects ±s.e.m. for each of the four experiments. The data have been normalized so that the threshold in the absence of polarization before ischaemia produced an excitability of unity. The intra-ischaemic threshold with zero polarization is indicated by the vertical arrows. As in other figures, D-H represents sequences in which the polarizing current started with depolarization and ended with hyperpolarization. For H-D the polarization was stepped from hyperpolarization to depolarization. C shows the absolute values of refractoriness when polarization was zero (means and s.e.m.). The displacement of the relationships during ischaemia was significant (for 10 ms currents: D-H, P = 0.011 and H-D, P = 0.005; for 100 ms currents: D-H, P = 0.011 and H-D, P = 0.001).
Figure 8
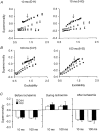
Figure 8. Changes in supernormality and its relationship to excitability
Data are for six subjects (means ±s.e.m.) displayed using the same format as in Fig. 7 (⋄, before ischaemia; •, during ischaemia; ▴, after ischaemia). Thus A and B illustrate the mean threshold change at the 7 ms conditioning-test interval for the six subjects for the two polarizing current durations and the two directions of step change in polarizing current. The data have been normalized so that the pre-ischaemic threshold in the absence of polarizing current equals an excitability of unity. The vertical arrows indicate the intra-ischaemic values when polarization was zero. C illustrates the absolute values when the polarizing current was zero for each experiment (means and s.e.m.). The slopes for the post-ischaemic relationships are significantly less than those prior to ischaemia (for 10 ms currents, P = 0.003 and 0.023; and for 100 ms currents, P = 0.017 and 0.032; for the D-H and H-D sequences, respectively).
Figure 3
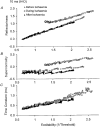
Figure 3. Relationships between excitability and refractoriness, supernormality and τSD
The reciprocal of threshold measured using an unconditioned 0.1 ms test pulse is used as an indicator of axonal excitability (x-axis). The unpolarized (resting) state is indicated by the vertical open bar. There are near-linear relationships between excitability and the other indices. Same data as in Fig. 2C. Data from one experiment.
Figure 5
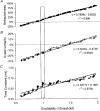
Figure 5. Effects of ischaemia and its release on the relationships of refractoriness, supernormality and τSD to excitability
Data from one experiment using 10 ms polarizing currents, the polarization cycle starting with hyperpolarizing steps before ischaemia, with depolarizing steps during ischaemia and with hyperpolarizing steps after release of ischaemia. A, for refractoriness the data before and after ischaemia fall along the same regression line, but during ischaemia the relationship is shifted upwards and towards higher excitability, and the slope is reduced (the overall change being significant, P = 0.013). B, for supernormality the relationships with excitability differ before, during and after ischaemia (P = 0.007 and 0.028, before-during and before-after, respectively). However, during ischaemia, the threshold change was probably dominated by refractoriness. C, for τSD the three relationships do not differ significantly.
Figure 6
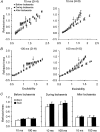
Figure 6. τSD and its relationship to excitability before, during and after ischaemia
The left panels in A and B illustrate the absolute values for τSD before, during and after ischaemia in the absence of polarizing current, for experiments in which the polarizing current lasted 10 ms (A) and 100 ms (B). The right panels illustrate the slope of the relationships with excitability. The data are mean values and s.e.m. for six subjects. The direction of the polarizing steps did not affect the values, and the data for the two experiments for each subject were averaged.
Figure 9
Figure 9. Continuous depolarizing current
A shows mean data for six subjects in whom a hyperpolarizing current lasting 10 ms was injected to balance the depolarization produced by ischaemia for 13 min. The mean threshold change produced by ischaemia is shown in the upper trace and the current required to offset the threshold change is shown in the lower trace. Note that while threshold reached a plateau, the current required to return threshold to the pre-ischaemic level continued to increase. B, plot of the data in A, showing the non-linearity. C, changes in unconditioned threshold (middle traces) and refractoriness (upper traces) produced by a prolonged depolarizing current ramp (lower trace). In the upper and middle traces, depolarizing and hyperpolarizing currents lasting 30 ms were delivered 10 ms before the test stimuli. Data from one subject.
Figure 10
Figure 10. Effects of continuous polarizing current on refractoriness
The relationships between refractoriness and excitability tested using brief polarizing currents lasting 100 ms before and during a prolonged depolarizing current ramp lasting 8 min. Data for one subject. The symbols in the upper panel indicate data for the different polarization levels. The lower panel plots the relationship between refractoriness and excitability using the five levels of polarization. The vertical arrows indicate the data at rest (○) for the five levels of polarization; the equivalent data points 2, 4, 6 and 8 min into the prolonged depolarizing current are shown (▴). Each data point represents the mean over a 1 min interval.

References

    1. Baker M, Bostock H. Depolarization changes the mechanism of accommodation in rat and human motor axons. The Journal of Physiology. 1989;411:545–561. - PMC - PubMed
    1. Baker M, Bostock H, Grafe P, Martius P. Function and distribution of three types of rectifying channel in rat spinal root myelinated axons. The Journal of Physiology. 1987;383:45–67. - PMC - PubMed
    1. Barrett EF, Barrett JN. Intracellular recording from vertebrate myelinated axons: mechanism of the depolarizing afterpotential. The Journal of Physiology. 1982;323:117–144. - PMC - PubMed
    1. Bostock H, Baker M. Evidence for two types of potassium channel in human motor axons in vivo. Brain Research. 1988;462:354–358. - PubMed
    1. Bostock H, Baker M, Grafe P, Reid G. Changes in excitability and accommodation of human motor axons following brief periods of ischaemia. The Journal of Physiology. 1991a;441:513–535. - PMC - PubMed

Publication types

Substances

LinkOut - more resources