. 1999 Jul;67(7):3242-7.
doi: 10.1128/IAI.67.7.3242-3247.1999.

Increase in gamma interferon-secreting CD8(+), as well as CD4(+), T cells in lungs following aerosol infection with Mycobacterium tuberculosis

Affiliations

Increase in gamma interferon-secreting CD8(+), as well as CD4(+), T cells in lungs following aerosol infection with Mycobacterium tuberculosis

C G Feng et al. Infect Immun. 1999 Jul.

Abstract

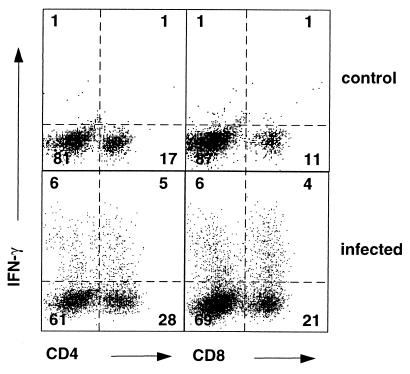
Although it is well established that CD4(+) T cells are required for the protective immune response against tuberculosis (TB), there is some evidence that CD8(+) T cells are also involved in the host response to Mycobacterium tuberculosis. There is, however, a paucity of information on the pulmonary CD8(+) T-cell response during infection. We therefore have compared the changes in both CD8(+) and CD4(+) T cells following aerosol infection with M. tuberculosis. There was an observed delay between the peak of infection and the activated T-cell response in the lung. The kinetics of CD8(+) and CD4(+) T-cell responses in the lung were identical, both peaking at week 8, 4 weeks later than the peak of cellular response in draining lymph nodes. Similar changes in activation/memory phenotypes occurred on the pulmonary CD8(+) and CD4(+) T cells. Following in vitro restimulation, both subsets synthesized gamma interferon, a cytokine essential for controlling M. tuberculosis infection. Since lung CD8(+) T cells are actively expanded during aerosol M. tuberculosis infection, it is important that both CD8(+) and CD4(+) T cells be targeted in the design of future TB vaccines.


Figures

FIG. 1
FIG. 1
Kinetics of cellular responses in the lung, MLN, and spleen. Cell numbers in the lung, MLN, and spleen were examined at 0, 4, 8, and 12 weeks after aerosol M. tuberculosis infection. Data are presented as the mean and standard error for three mice in one of two separate experiments. The significance of the differences in cell number between weeks 4 and 8 postinfection was determined by unpaired Student’s t test. The number of CD4+ and CD8+ T cells in the lung at 8 weeks was significantly greater (P < 0.05) than at 4 weeks, while there was no significant difference in the numbers of CD4+ and CD8+ T cells in MLN between 4 and 8 weeks.
FIG. 2
FIG. 2
Change in the expression of activation markers on CD4+ and CD8+ T cells in infected lungs. Cells isolated from the lung at week 8 postinfection were analyzed by multiparameter FACS. The histogram profiles show the expression of activation markers after gating on lymphocytes and CD4+ and CD8+ T cells. The profiles are representative of three to six mice. Numbers in the histograms indicate percentages of CD4+ and CD8+ T cells for each molecule. The differences between control and infected mice were significant for all markers analyzed (P < 0.05, unpaired Student’s t test).
FIG. 3
FIG. 3
Delay between the peak of infection (CFU) and accumulation of activated CD4+ and CD8+ T cells in infected lungs. The course of infection, expressed as CFU (■), was compared with the kinetics of influx of activated T cells. The expression of CD44hi CD45RBlo (○) or CD69+ (●) was used to define the activated CD4+ and CD8+ T cells. Data are presented as the mean and standard error for three mice from one of two separate experiments.
FIG. 4
FIG. 4
Change in the expression of activation markers on CD4+ and CD8+ T cells in MLN. Cells isolated from the MLN at weeks 2, 4, 8, and 12 postinfection were analyzed by multiparameter FACS. The expression of CD44hi CD45RBlo or CD69+ was used to define the activated CD4+ and CD8+ T cells. Data are presented as the mean and standard errors for three mice from one of two separate experiments. The significance of the differences in each subset between control mice and mice at 2, 4, 8, and 12 weeks postinfection was determined by unpaired Student’s t test. There were no significant differences in both percentage and absolute number of activated T cells between control mice and mice at 4, 8, and 12 weeks postinfection. The change in the proportion of activated T cells in either subset throughout the course of infection was not statistically different. There was a significant difference in absolute number of activated T cells between control mice and mice at 4, 8, and 12 weeks postinfection (P < 0.05).
FIG. 5
FIG. 5
Progressive loss of expression of CD62L on both CD4+ and CD8+ T cells. Cells from lungs and MLN were harvested at weeks 0, 4, 8, and 12 after aerosol infection. The CD62L expression on CD4+ and CD8+ T cells was analyzed after gating on viable lymphocytes. Data are presented as mean and standard error for three mice in one of two separate experiments. There were significant differences between control mice and mice at 4, 8, and 12 weeks postinfection in both lungs and MLN (P < 0.05).
FIG. 6
FIG. 6
Coexpression of CD44 and CD45RB and CD11a on CD4+ (A) and CD8+ (B) T cells. Cells isolated from lungs at week 8 after infection were analyzed as described for Fig. 2. The profiles shown are representative of three mice from one of two separate experiments. Numbers in the quadrants indicate percentages of CD4+ and CD8+ T cells.
FIG. 7
FIG. 7
Recall IFN-γ production by CD4+ and CD8+ T cells in infected and uninfected mice. Lung cells isolated from mice 8 weeks after aerosol infection or from uninfected control mice were cultured at 106/ml with solid-phase anti-CD3 MAb for 24 h. Intracellular staining for IFN-γ was performed after surface staining of CD4 and CD8 molecules. The profiles shown are representative of three mice from one of two separate experiments. Numbers in the quadrants indicate percentages of total viable lymphocytes.

References

    1. Andersen P. Host responses and antigens involved in protective immunity to Mycobacterium tuberculosis. Scand J Immunol. 1997;45:115–131. - PubMed
    1. Andersen P, Andersen A B, Sorensen A L, Nagai S. Recall of long-lived immunity to Mycobacterium tuberculosis infection in mice. J Immunol. 1995;154:3359–3372. - PubMed
    1. Barnes P F, Mistry S D, Cooper C L, Pirmez C, Rea T H, Modlin R L. Compartmentalization of a CD4+ T lymphocyte subpopulation in tuberculous pleuritis. J Immunol. 1989;142:1114–1119. - PubMed
    1. Baumgarth N, Egerton M, Kelso A. Activated T cells from draining lymph nodes and an effector site differ in their responses to TCR stimulation. J Immunol. 1997;159:1182–1191. - PubMed
    1. Baumgarth N, Kelso A. Functionally distinct T cells in three compartments of the respiratory tract after influenza virus infection. Eur J Immunol. 1996;26:2189–2197. - PubMed

Publication types

Substances