Comparative Study
. 1999 Jul 1;19(13):5311-21.
doi: 10.1523/JNEUROSCI.19-13-05311.1999.

Fast excitatory synaptic transmission mediated by nicotinic acetylcholine receptors in Drosophila neurons

Affiliations
Comparative Study

Fast excitatory synaptic transmission mediated by nicotinic acetylcholine receptors in Drosophila neurons

D Lee et al. J Neurosci. .

Abstract

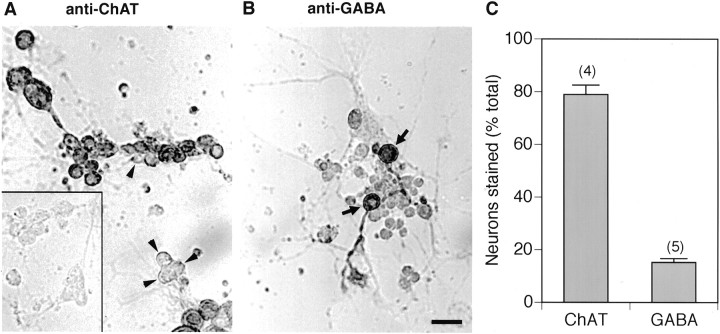
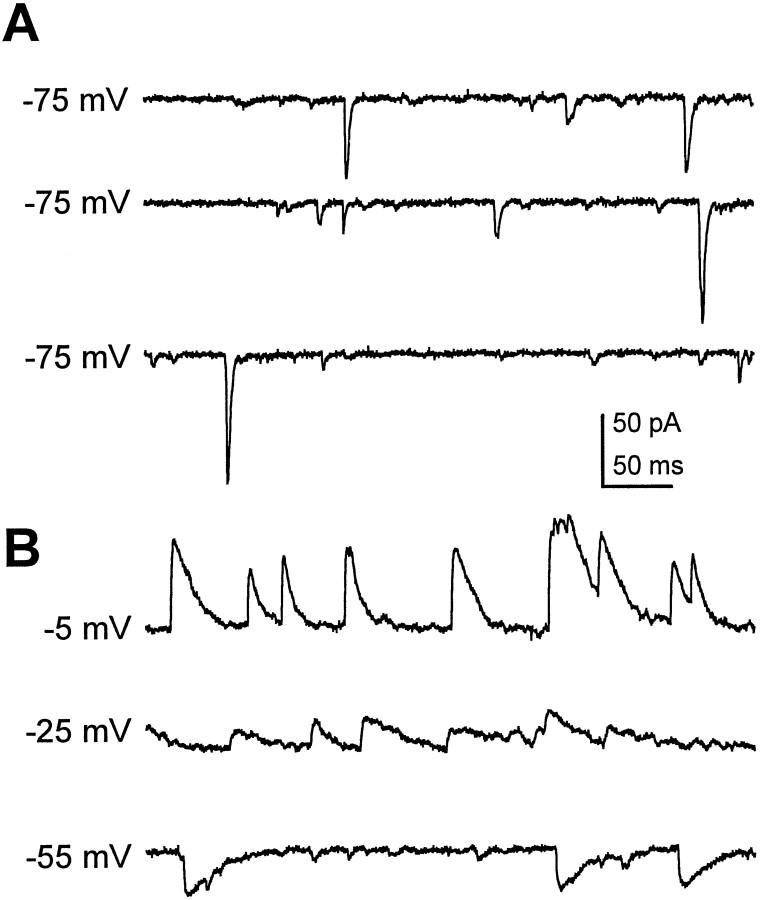
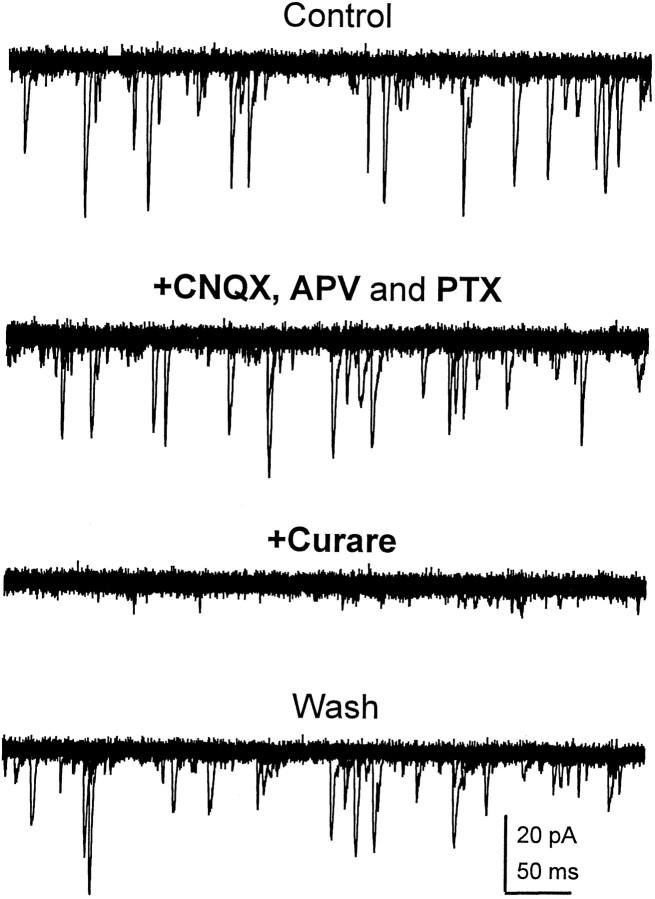
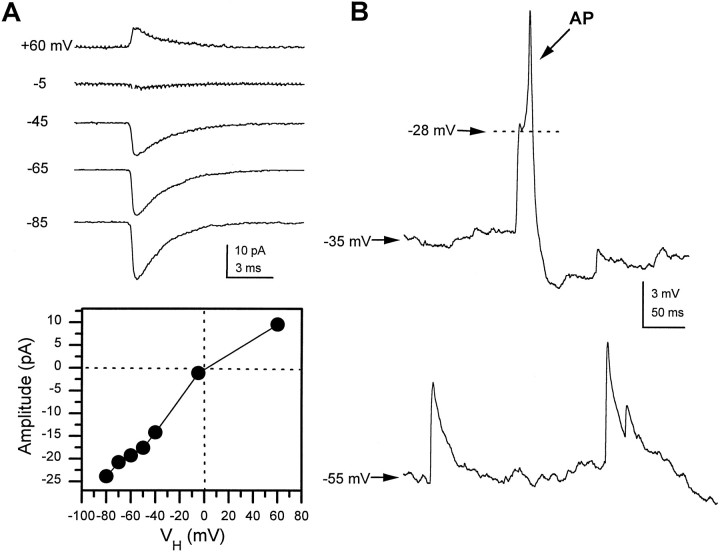
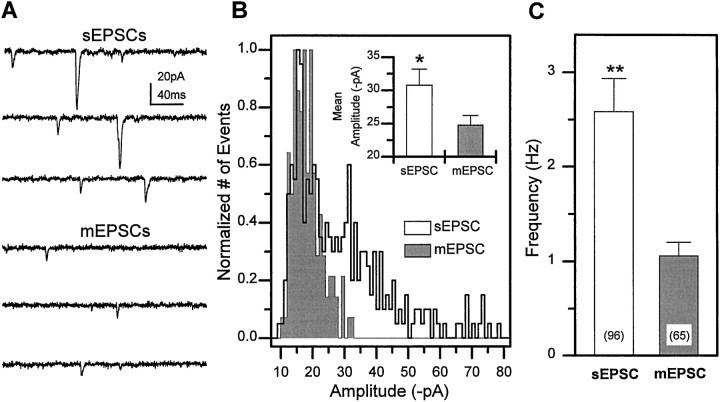
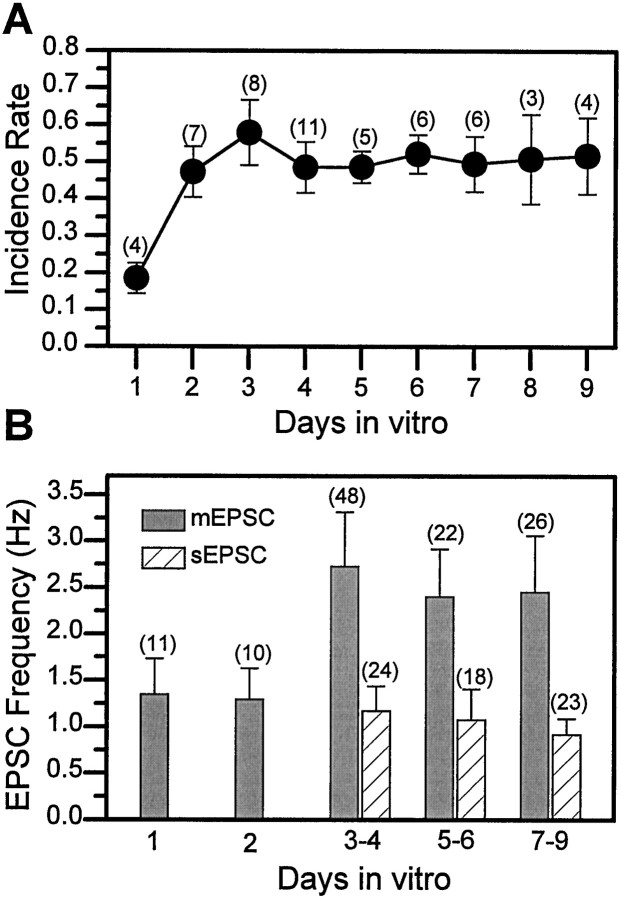
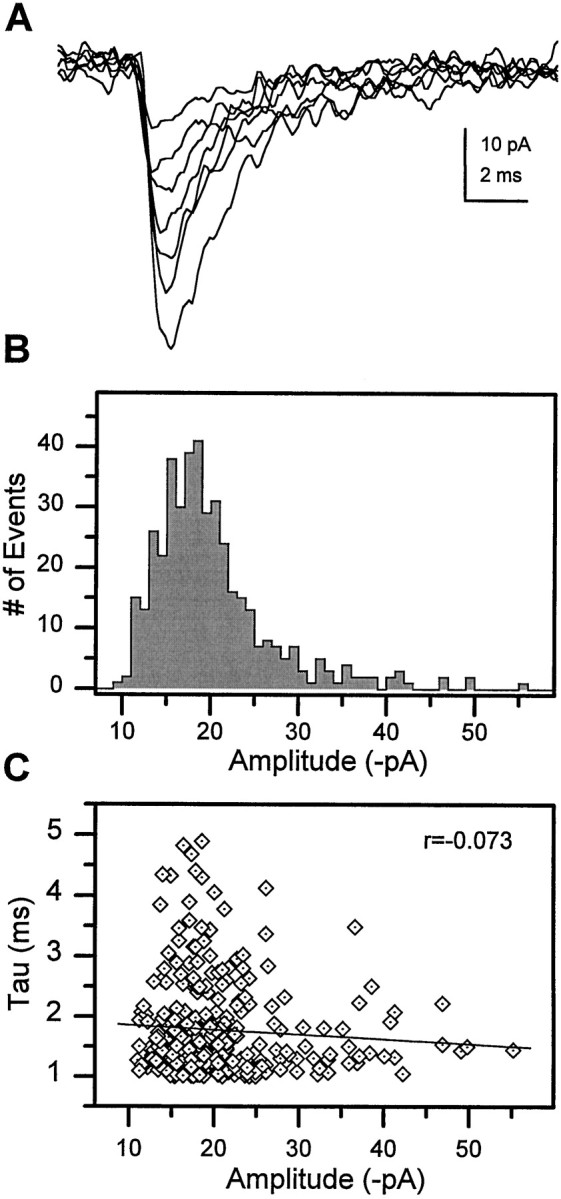
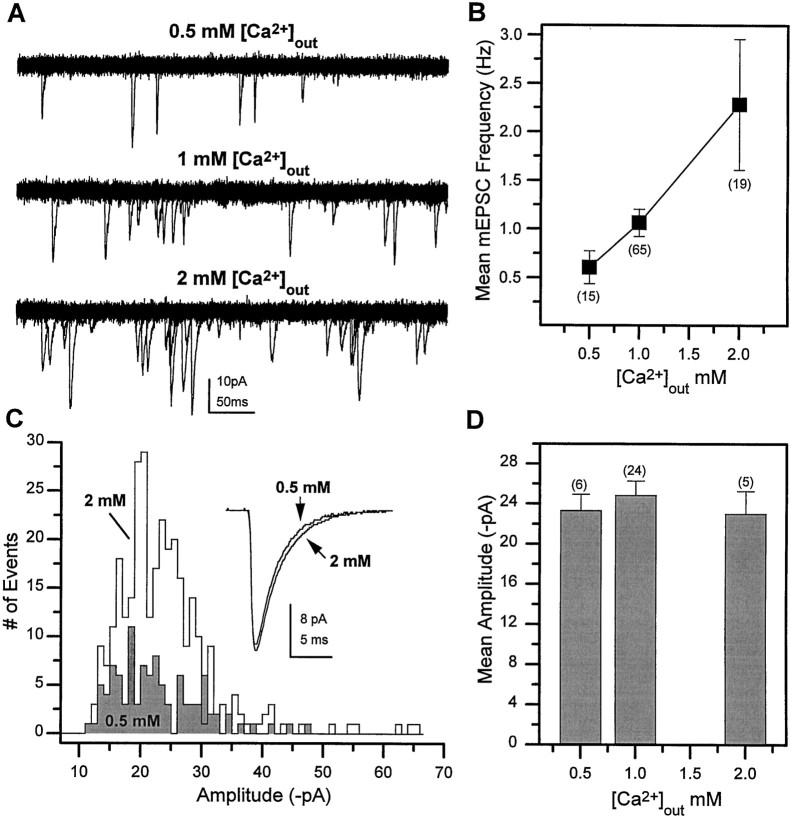
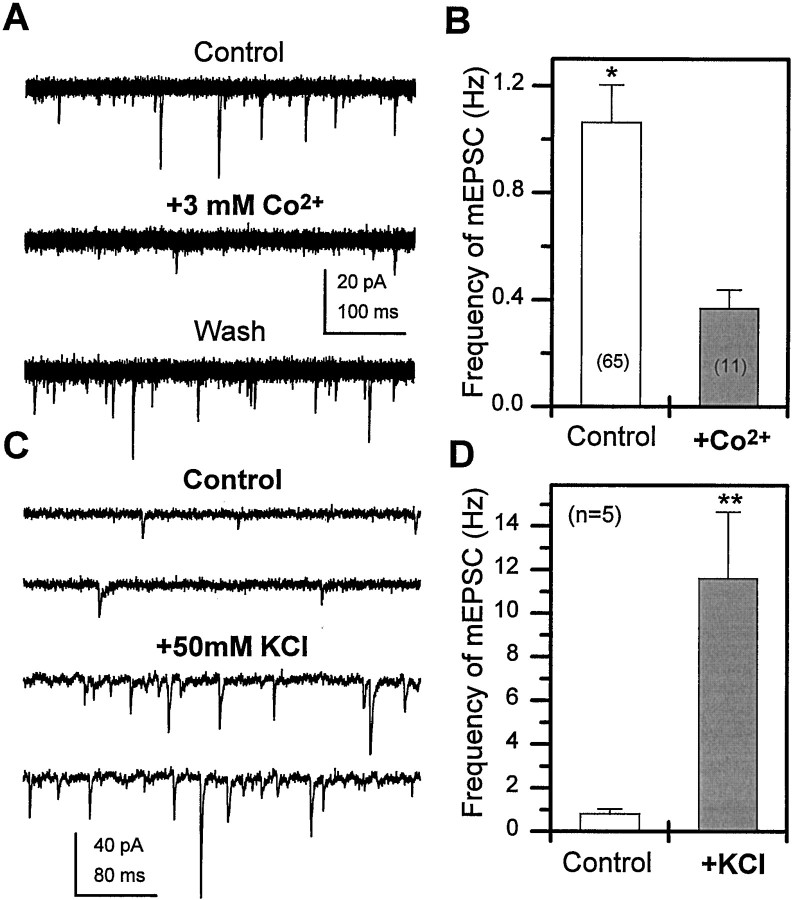
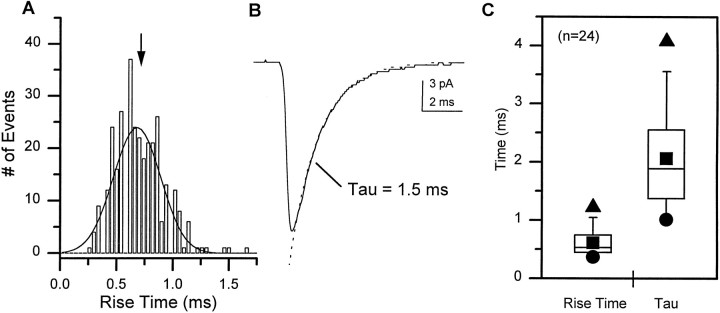
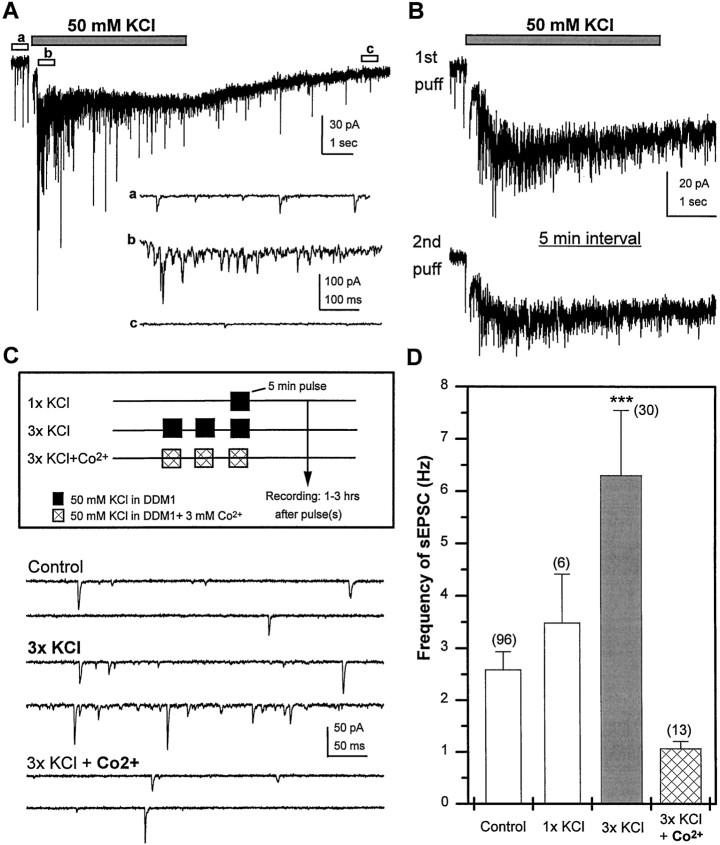
Difficulty in recording from single neurons in vivo has precluded functional analyses of transmission at central synapses in Drosophila, where the neurotransmitters and receptors mediating fast synaptic transmission have yet to be identified. Here we demonstrate that spontaneously active synaptic connections form between cultured neurons prepared from wild-type embryos and provide the first direct evidence that both acetylcholine and GABA mediate fast interneuronal synaptic transmission in Drosophila. The predominant type of fast excitatory transmission between cultured neurons is mediated by nicotinic acetylcholine receptors (nAChRs). Detailed analysis of cholinergic transmission reveals that spontaneous EPSCs (sEPSCs) are composed of both evoked and action potential-independent [miniature EPSC (mEPSC)] components. The mEPSCs are characterized by a broad, positively skewed amplitude histogram in which the variance is likely to reflect differences in the currents induced by single quanta. Biophysical characteristics of the cholinergic mEPSCs include a rapid rise time (0.6 msec) and decay (tau = 2 msec). Regulation of mEPSC frequency by external calcium and cobalt suggests that calcium influx through voltage-gated channels influences the probability of ACh release. In addition, brief depolarization of the cultures with KCl can induce a calcium-dependent increase in sEPSC frequency that persists for up to 3 hr after termination of the stimulus, illustrating one form of plasticity at these cholinergic synapses. These data demonstrate that cultured embryonic neurons, amenable to both genetic and biochemical manipulations, present a unique opportunity to define genes/signal transduction cascades involved in functional regulation of fast excitatory transmission at interneuronal cholinergic synapses in Drosophila.


Figures

Fig. 1.
Fig. 1.
ChAT and GABA expression in culturedDrosophila neurons. A, Bright-field photomicrograph of a culture at 6 DIV stained with a monoclonal antibody to choline acetyltransferase (ChAT). Although the majority of neurons are positive in this field of view, unstained neurons are indicated by arrowheads.Inset, Background level of staining in the absence of primary antibody. B, Bright-field photomicrograph of a culture at 4 DIV stained with a polyclonal antibody to GABA. Two positive neurons are indicated by arrows. Scale bar, 20 μm. C, Quantitative analysis of the percentage of neurons positive for ChAT or GABA assessed in cultures between 3 and 6 DIV. Bars indicate SEM, and number of experiments is indicated inparentheses.
Fig. 2.
Fig. 2.
Two classes of kinetically distinct spontaneous synaptic currents recorded from cultured Drosophilaneurons. A, Fast sPSCs recorded from a neuron at 3 DIV, typical of the currents recorded in ∼50% of the wild-type neurons. Holding potential was −75 mV. B, An example of a kinetically distinct class of sPSCs, recorded in a second wild-type neuron at 3 DIV, is characterized by a slow decay time constant. These slow sPSCs are inward when the cell is held at −55 mV and outward at −25 and −5 mV, reversing near the calculated chloride equilibrium potential (−46 mV).
Fig. 3.
Fig. 3.
Fast transient synaptic currents are mediated by nAChRs. Superimposed current traces (20 × 500 msec sweeps) at a holding potential of −75 mV during bath perfusion with indicated drugs at the following concentrations: APV, 50 μm; CNQX, 5 μm; PTX, 10 μm; and curare, 100 nm. Records obtained from a single neuron at 6 DIV. Fast sPSCs were reversibly blocked by bath application of curare but were not affected by CNQX, APV, or PTX.
Fig. 4.
Fig. 4.
Cholinergic synaptic currents are excitatory. A, Averaged mEPSCs (>20 traces at each potential) recorded in the presence of 1 μm TTX from a single neuron at 6 DIV at indicated holding potentials. The peak current–voltage relationship indicates a reversal potential near 0 mV. B, In current-clamp mode, nAChR-mediated sEPSPs were recorded from a single neuron (6 DIV) at two different holding potentials. At rest, −35 mV in this neuron, an sEPSP triggers a spontaneous AP with a threshold at −28 mV. When the cell is held at −55 mV by injection of hyperpolarizing current, the sEPSPs are depolarizing, but they do not give rise to regenerative events.
Fig. 5.
Fig. 5.
sEPSCs have both TTX-sensitive and TTX-insensitive components. A, sEPSCs recorded from a single wild-type neuron (5 DIV) at −75 mV in normal external solution (top three traces). mEPSCs recorded from the same neuron after perfusion of the bathing media with 1 μm TTX to block spontaneous APs (bottom three traces).B, Amplitude distribution of sEPSCs versus mEPSCs recorded from the same neuron. Inset, The mean sEPSC amplitude was significantly larger than the mEPSC amplitude in the population of neurons examined (*p < 0.05, Student’s t test). C, The average sEPSC frequency was also significantly higher than mEPSC frequency in wt1 neurons (**p < 0.01, Student’s ttest). Bars indicate SEM, and number of neurons is indicatedparentheses.
Fig. 6.
Fig. 6.
Incidence and frequency of EPSCs are stable in neurons at ≥ 3 d in vitro (DIV).A, The average percentage of neurons in which sEPSCs were recorded was determined on a daily basis from multiple experiments (n) with total of 17–69 wild-type neurons examined at each day. B, In the cells in which synaptic currents were recorded, the sEPSC/mEPSC frequency was determined and plotted as a function of days in culture. All sEPSCs were recorded in control saline, and all mEPSCs were recorded in the presence of 1 μm TTX. Bars indicate SEM, and number of neurons is indicated in parentheses.
Fig. 7.
Fig. 7.
Broad, skewed mEPSC amplitude histogram in single cells. A, Variability in the amplitude of individual mEPSCs in a single neuron at 7 DIV. B, The mEPSC amplitude histogram constructed from 408 individual events recorded from this neuron reveals a broad distribution that is positively skewed. C, Scatter plot of amplitude versus decay time constant for the individual events. A linear regression fit to the data demonstrates little correlation (r = −0.073), indicating that the amplitude variability is not caused by electrotonic filtering.
Fig. 8.
Fig. 8.
mEPSC frequency but not amplitude is regulated by extracellular Ca2+ concentration.A, Superimposed current traces (20 × 500 msec sweeps in each) obtained at three different extracellular calcium concentrations in the presence of 1 μm TTX.B, Mean mEPSC frequency in the indicated number of neurons at three different calcium concentrations. C, mEPSC amplitude histograms from a single cell at 2 mm and 0.5 mm Ca2+. Inset, Averaged mEPSCs generated from 103 events in 0.5 mm Ca2+and from 310 events in 2 mm Ca2+.D, The mean mEPSC amplitude observed in the indicated number of neurons at three different external calcium concentrations. Bars indicate SEM, and number of neurons is indicated inparentheses.
Fig. 9.
Fig. 9.
Flux of calcium through voltage-gated ion channels regulates mEPSC frequency at rest and during depolarization.A, Superimposed current traces (20 × 500 msec sweeps in each) reveal a reversible decrease in mEPSC frequency when 3 mm Co2+ is added to the recording solution (1 μm TTX, 1 mmCa2+). B, The mean mEPSC frequency was significantly lower in recordings obtained from neurons in the presence of 3 mm Co2+ when compared with control (*p < 0.05, Student’s ttest). C, Top two traces represent current recordings from a neuron in control solution (1 μm TTX, 1 mm Ca2+). Thebottom two traces, recorded after pressure ejection of 50 mm KCl from a pipette located ∼20 μm from the cell body, represent the average increase in mEPSC frequency seen during the 10 sec KCl puff. D, The mean mEPSC frequency recorded before (Control) and during the 10 sec puff of 50 mm KCl (**p < 0.01, Student’st test). Bars indicate SEM, and number of neurons is indicated in parentheses.
Fig. 10.
Fig. 10.
Cholinergic mEPSCs are characterized by rapid activation and decay kinetics. A, A histogram of the 10–90% rise time was generated from 314 events recorded from a single neuron at 7 DIV. The data are fit with a single Gaussian curve with the mean indicated by the arrow. B, The averaged mEPSC in this neuron exhibits a typical rapid decay phase that is well fit by a single exponential distribution with a τ of 1.5 msec. C, A box plot illustrates the variability in the 10–90% rise time and decay time constant for the mEPSCs in the population of neurons examined. The 5th and 95th percentiles are indicated by the whiskers, and the 25th, 50th, and 75th percentile boundaries are indicated by thebox for each group. ▴, Maximum values; ●, minimum values; ▪, the mean.
Fig. 11.
Fig. 11.
Brief depolarization of differentiated wild-type neurons induces calcium-dependent persistent increase in sEPSC frequency. A, A 5 sec, focal application of 50 mm KCl, pressure-ejected from a micropipette ∼20 μm from the cell body, induces a rapid and transient increase in sEPSC frequency riding on a sustained inward current, followed by a decline to below baseline levels within 10 sec. Higher-resolution images of sEPSCs recorded before (a), during (b), and after (c) the KCl puff are indicated below.B, In a single neuron, similar responses are observed to two puffs of KCl when separated by a 5 min rest period in normal external solution. C, Three different paradigms used for global depolarization of cultures at 3–6 DIV by exposure to 50 mm KCl in DDM1. Recordings obtained 1–3 hr after stimulus illustrate an increase in sEPSC frequency after repetitive KCl stimulation that is blocked if stimulation is conducted in the presence of Co2+. D, Mean sEPSC frequency, assayed 1–3 hr after treatment, is plotted for each of the depolarization paradigms. The slightly higher mean sEPSC frequency after 1x KCl was not significantly different from control. However, a significant increase in sEPSC frequency was observed in cultures treated with high 3x KCl when compared with control (ANOVA; ***p < 0.0001, Fisher PLSD). This increase was blocked when Co2+ was present during the repeated exposure to high potassium. Bars indicate SEM, and the number of neurons is indicated in parentheses.

Similar articles

Cited by

References

    1. Baines RA, Bate M. Electrophysiological development of central neurons in the Drosophila embryo. J Neurosci. 1998;18:4673–4683. - PMC - PubMed
    1. Banker G, Goslin K. Culturing nerve cells. Cellular and molecular neuroscience series. MIT; Cambridge, MA: 1991.
    1. Bekkers JM, Stevens CF. NMDA and non-NMDA receptors are co-localized at individual excitatory synapses in cultured rat hippocampus. Nature. 1989;341:230–233. - PubMed
    1. Bekkers JM, Richerson GB, Stevens CF. Origin of variability in quantal size in cultured hippocampal neurons and hippocampal slices. Proc Natl Acad Sci USA. 1990;87:5359–5362. - PMC - PubMed
    1. Bertrand D, Ballivet M, Gomez M, Bertrand S, Phannavong B, Gundelfinger ED. Physiological properties of neuronal nicotinic receptors reconstituted from the vertebrate β2 subunit and Drosophila α-subunits. Eur J Neurosci. 1994;6:869–875. - PubMed

Publication types

MeSH terms