. 1999 Jul 1;19(13):5493-505.
doi: 10.1523/JNEUROSCI.19-13-05493.1999.

Prospective coding for objects in primate prefrontal cortex

Affiliations

Prospective coding for objects in primate prefrontal cortex

G Rainer et al. J Neurosci. .

Abstract

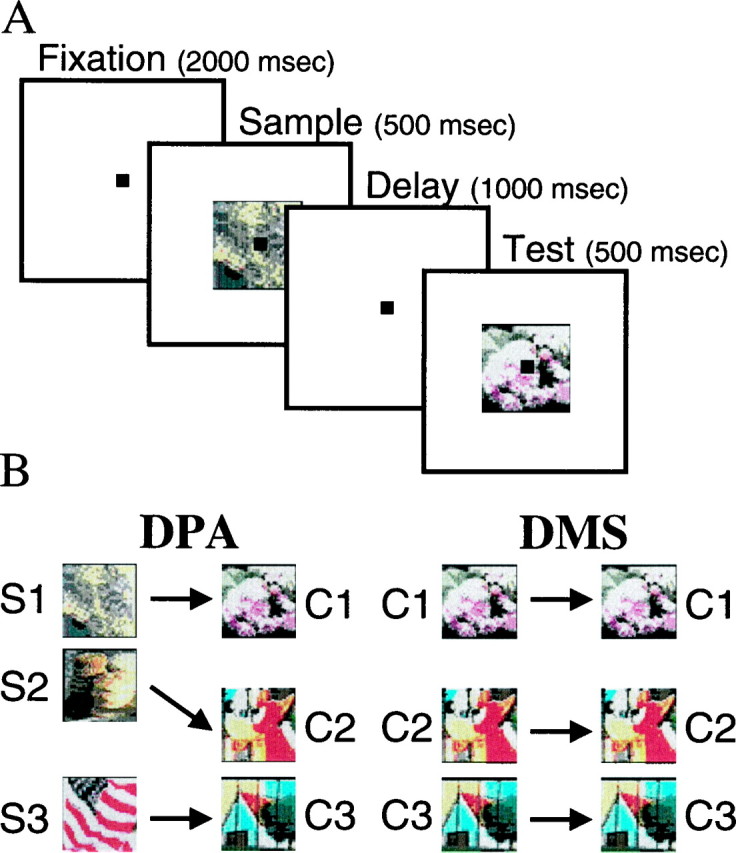
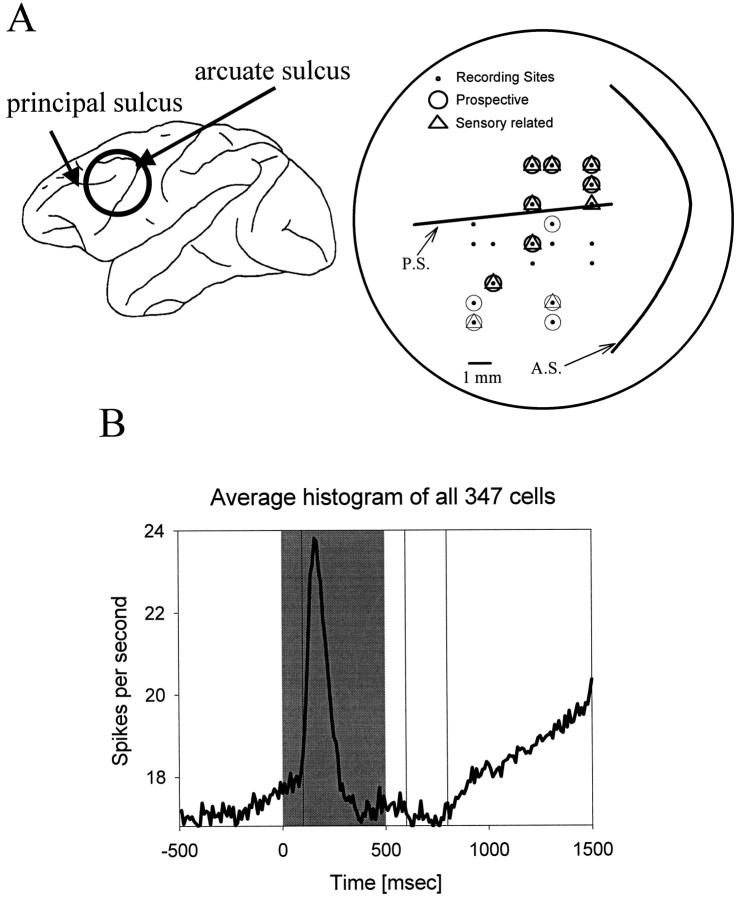
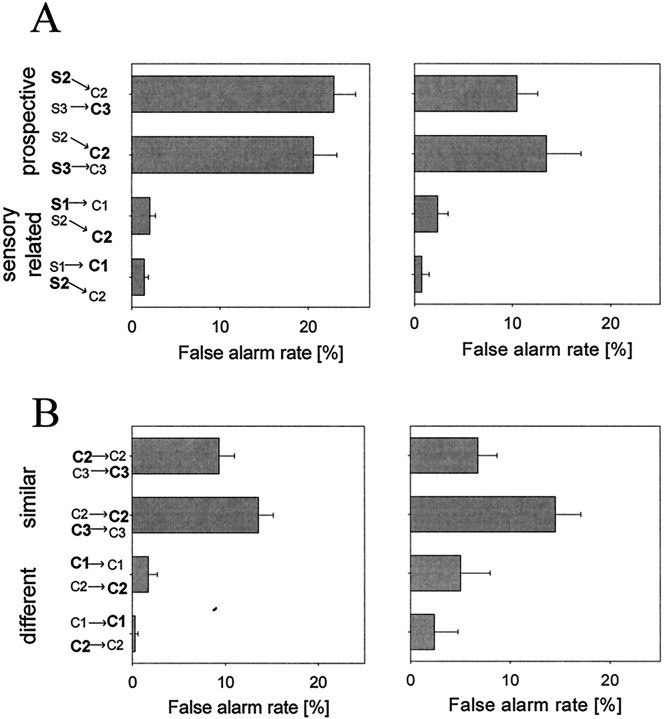
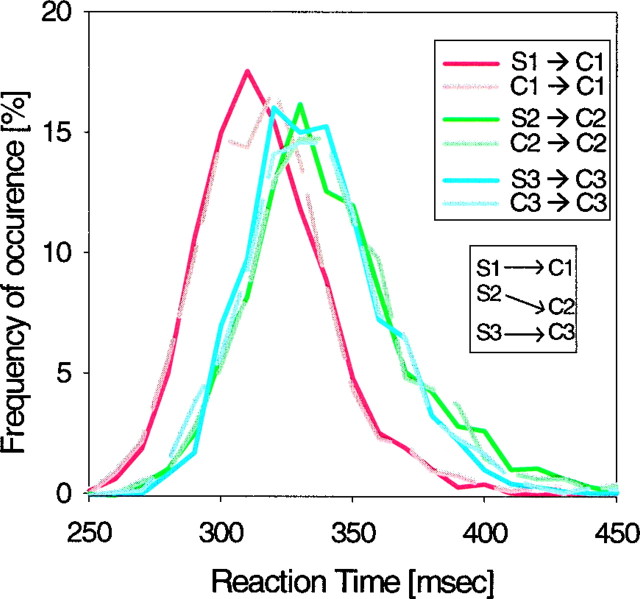
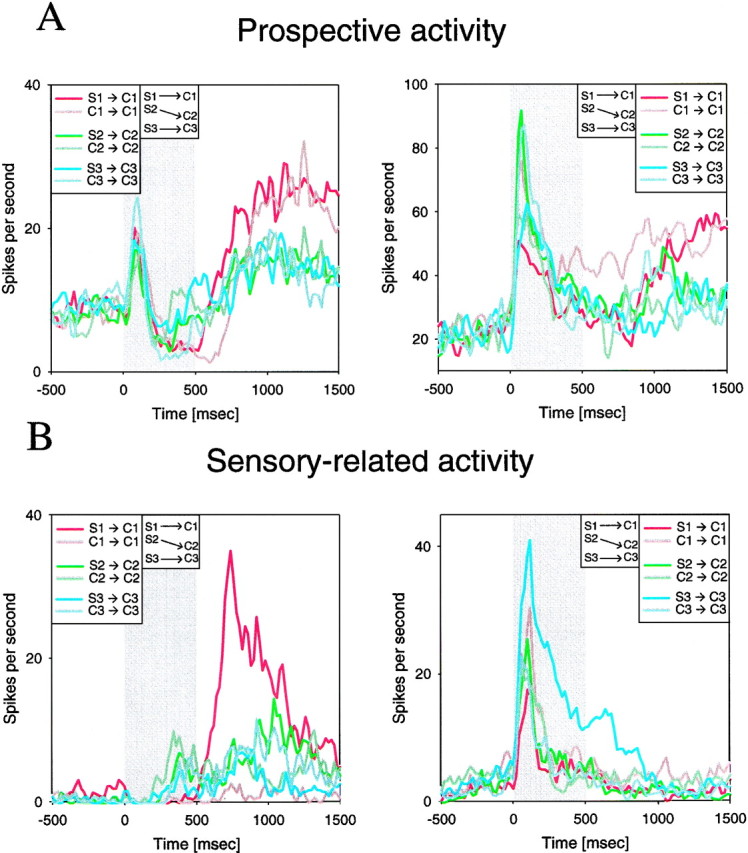
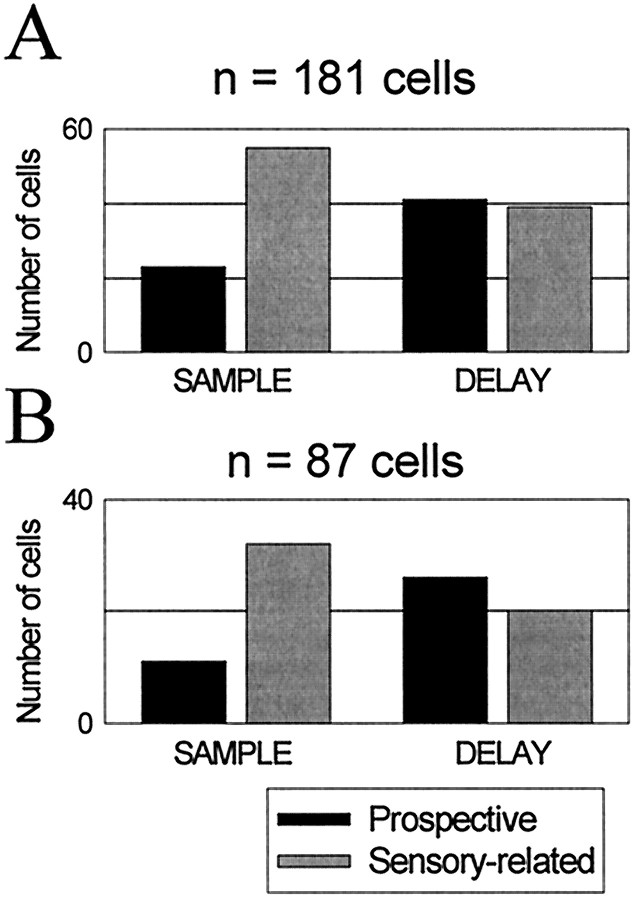
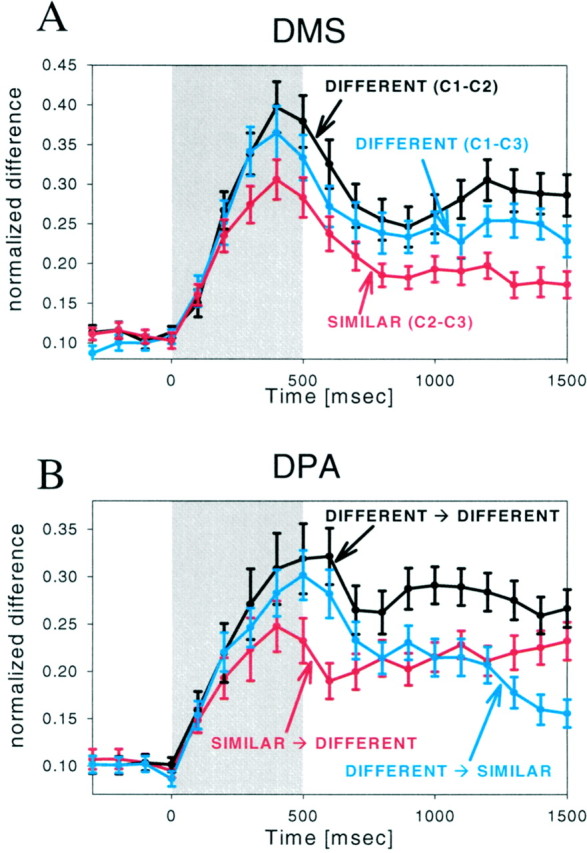
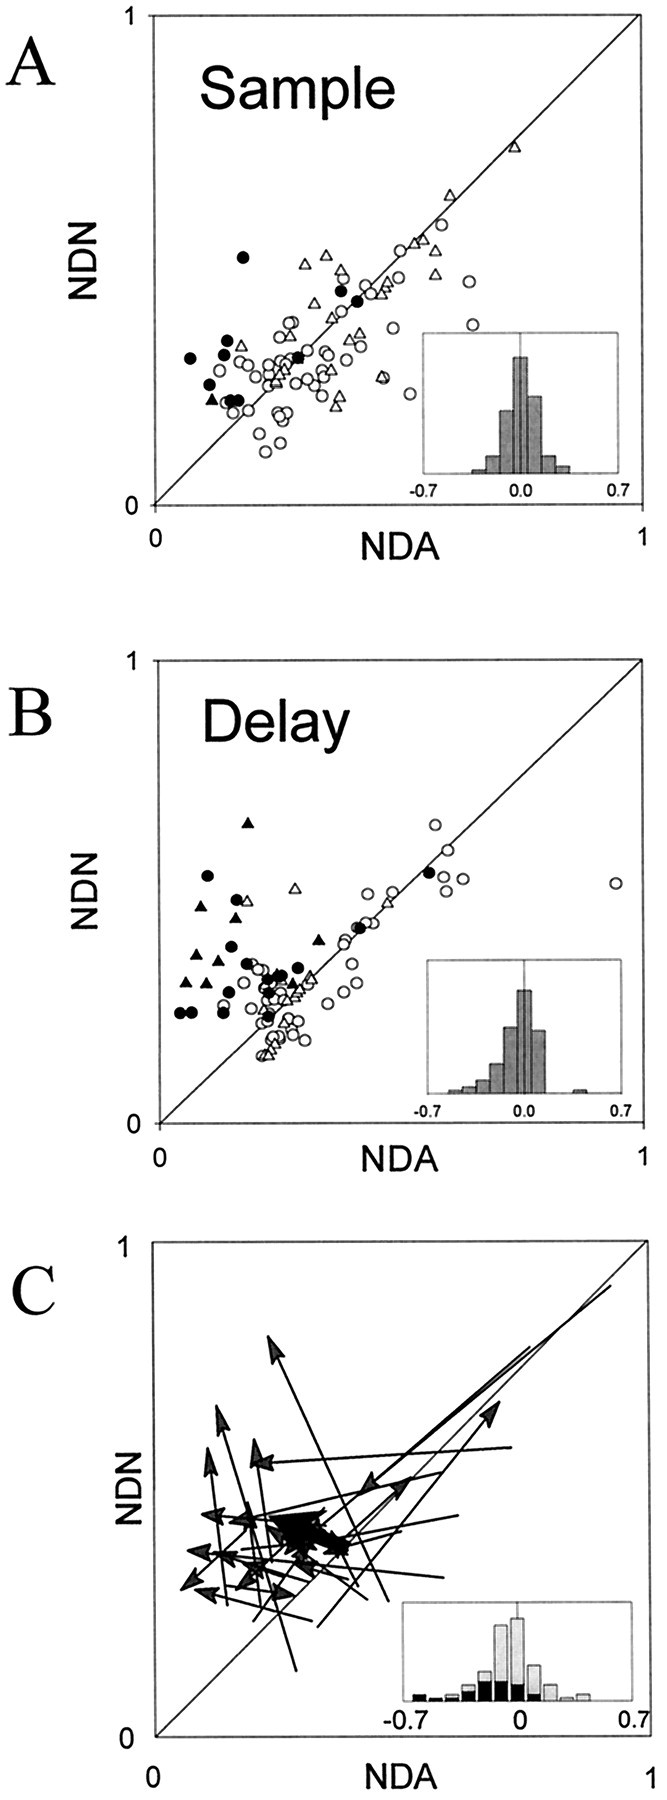
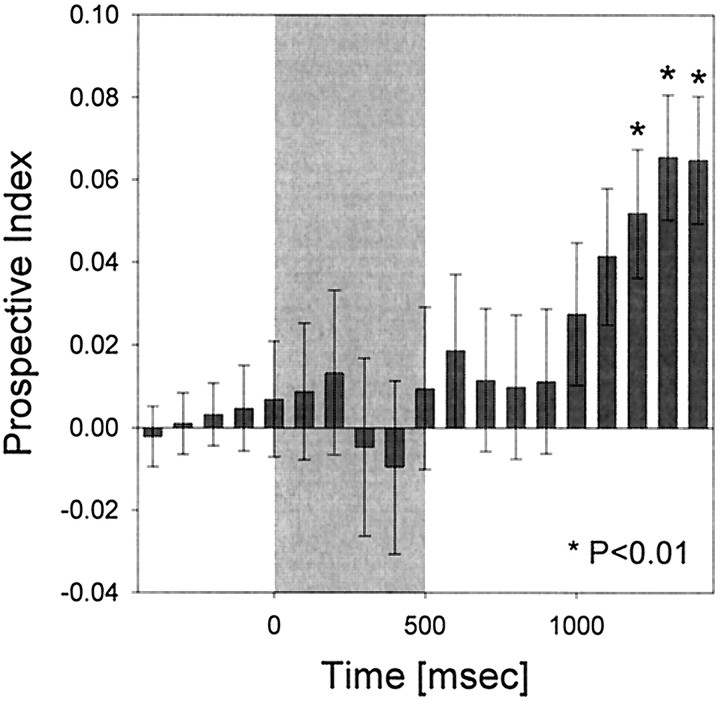
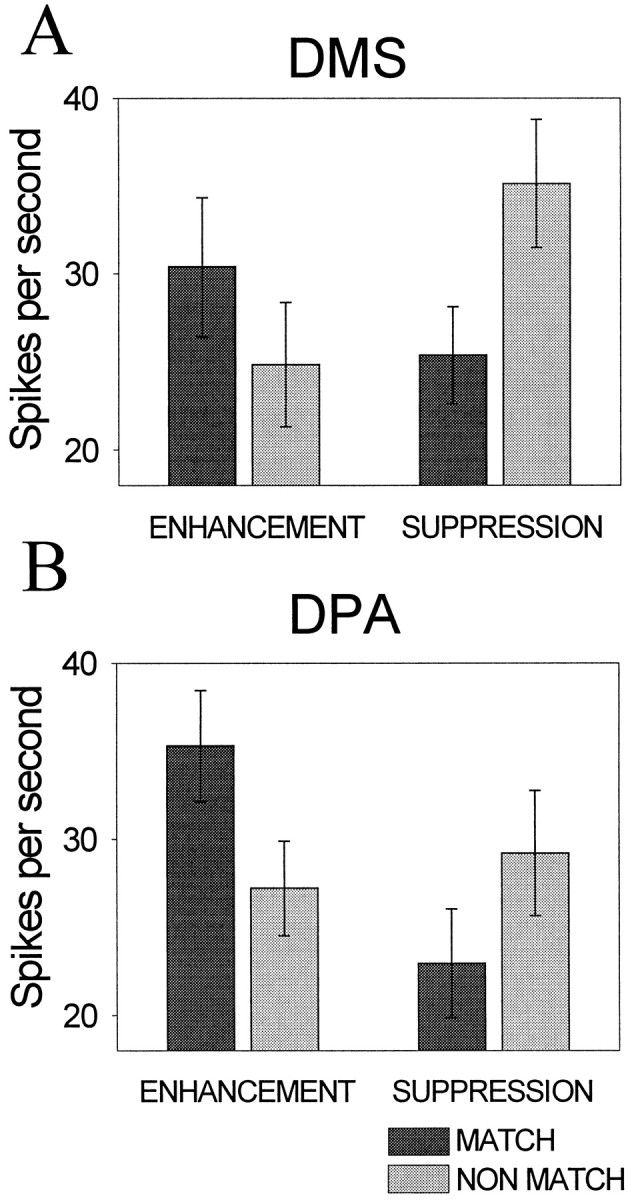
We examined neural activity in prefrontal (PF) cortex of monkeys performing a delayed paired associate task. Monkeys were cued with a sample object. Then, after a delay, a test object was presented. If the test object was the object associated with the sample during training (i.e., its target), they had to release a lever. Monkeys could bridge the delay by remembering the sample (a sensory-related code) and/or thinking ahead to the expected target (a prospective code). Examination of the monkeys' behavior suggested that they were relying on a prospective code. During and shortly after sample presentation, neural activity in the lateral PF cortex primarily reflected the sample. Toward the end of the delay, however, PF activity began to reflect the anticipated target, which indicated a prospective code. These results provide further confirmation that PF cortex does not simply buffer incoming visual inputs, but instead selectively processes information relevant to current behavioral demands, even when this information must be recalled from long-term memory.


Figures

Fig. 1.
Fig. 1.
A, Schematic diagram of the DPA task. After fixating for 2 sec, a sample object was presented at the center of gaze for 500 msec. After a subsequent 1000 msec delay, a test object was presented, which could be either a target or nontarget. The sequence of events was identical for the DMS task.B, Sample–target associations for both tasks. For each task, the test stimulus could either be a target (match) or nontarget (nonmatch). Stimuli for both tasks were chosen such that two of the three were similar to each other. Similarity is depicted as vertical proximity, such that S1 and S2, and C2 and C3 were similar and each were different from S3 and C1, respectively.
Fig. 2.
Fig. 2.
A, Location of recording sites. The recording sites were located around the principal sulcus and on the inferior convexity of the prefrontal cortex. Recording sites in the two monkeys were intermixed and nonoverlapping. The circlesand triangles depict where prospective and sensory-related cells were found. Recording sites from monkey A are shown as thick symbols, and those from monkey B are shown as thin symbols. B, Average histogram for all recorded cells. The curve represents the mean firing rate (bin width, 10 msec). The shaded gray area represents the period of sample object presentation. Theblack vertical lines delineate the sample and delay epochs described in Materials and Methods.
Fig. 3.
Fig. 3.
Average false alarm rates pooled across both monkeys for DPA (A) and DMS (B) tasks. Each bar gives the false alarm rate for the condition described on theleft. Shown in bold are the sample and the test object chosen in error for that trial. Thearrow points to the correct target for that sample. Thus, the top bar in A shows the error rate when the sample was S2 and the monkey chose C3 instead of the correct target S2. The error bars show the SEM. Performance of monkey A is shown on the left, and monkey B is shown on theright.
Fig. 4.
Fig. 4.
Histograms of bar release reaction times to the test object presentation pooled across both monkeys. Solid lines and dashed lines correspond to DPA and DMS tasks, respectively. The bin width was 10 msec.
Fig. 5.
Fig. 5.
Single cell examples of prospective (A) and sensory-related (B) memory. The cells on the right were recorded from monkey A, and the cells on the left were recorded from monkey B. Each colored line represents the firing rate of a single neuron after the sample object shown in the legend. Thegray shaded area represents the period of sample object presentation, which is followed by 1000 msec of delay shown to theright of the gray area. Histograms were binned at 20 msec and smoothed with a 20 msec Gaussian.
Fig. 6.
Fig. 6.
Histograms of cell counts classified as prospective and sensory-related in the population of 181 responsive cells (A) and in the 87 cells that showed selective activity in both the sample and the delay intervals (B). Classification is based on an ANOVA (see Results).
Fig. 7.
Fig. 7.
Time course of differences in firing rate between different combinations of conditions in the DMS (A) and DPA (B) task. Each plot corresponds to the average normalized difference in firing rate between conditions described in the legend (see Materials and Methods). Differences were calculated using a bin width of 100 msec. The average differences and SEs are shown for the population of 87 cells that showed selective activity in the sample and delay epochs. Thegray shaded area represents the time of sample object presentation.
Fig. 8.
Fig. 8.
Scatterplots showing the normalized difference of each cell to associated objects (NDA) plotted against the average normalized difference to nonassociated associated objects (NDN) for the sample (A) and delay periods (B). The insets inA and B show the distribution of NDA − NDN values. Neurons from monkeys A and B are shown ascircles and triangles, respectively. The black symbols represent cells classified as prospective using an independent method (two-way ANOVA; see Results). C, Vectors connecting change in corresponding NDA and NDN values from the sample to the delay interval, i.e., the change in the data point position for each cell from A to B. This is shown for the cells classified as prospective during the delay period (gray arrows). The black arrow represents the average vector. The insetshows the distribution δNDN − δNDA values (see Results) for the population of 87 cells with selective activity in both intervals (gray bars) and for the cells classified as prospective in the delay (black bars).
Fig. 9.
Fig. 9.
PI as a function of time. Eachbar shows the value of the PI calculated over a 400 msec bin. The PI value for each cell was calculated by first subtracting the NDA from the NDN value at each time bin. These values were then averaged across the 87 cells with selective activity in both the sample and delay epochs. High PI values indicate more similarity in activity when the same target object is expected relative to trials when different targets were expected. That is, the higher the PI value, the more prospective the activity. The gray shaded areacorresponds to the period of sample object presentation. Theasterisks indicate a significant difference between NDN and NDA values, evaluated at p < 0.01 using at test.
Fig. 10.
Fig. 10.
Match–nonmatch effects in the DMS (A) and DPA (B) tasks. Eachpair of bars shows the average firing rate to matching (targets) and nonmatching (nontargets) test objects for stimuli that elicited significant enhancement or suppression of responses to matches relative to nonmatches. The error bars show the SD.

References

    1. Asaad WF, Rainer G, Miller EK. Neural activity in the primate prefrontal cortex during associative learning. Neuron. 1998;21:1399–1407. - PubMed
    1. Barbas H. Anatomic organization of basoventral and mediodorsal visual recipient prefrontal regions in the rhesus monkey. J Comp Neurol. 1988;276:313–342. - PubMed
    1. Buckner RL, Raichle ME, Miezin FM, Petersen SE. Functional anatomic studies of memory retrieval for auditory words and visual pictures. J Neurosci. 1996;16:6219–6235. - PMC - PubMed
    1. Colombo M, Graziano MS. Effects of auditory and visual interference on auditory-visual delayed matching to sample in monkeys (Maca fascicularis). Behav Neurosci. 1994;108:636–639. - PubMed
    1. Constantinidis C, Steinmetz MA. Neuronal activity in posterior parietal area 7a during the delay periods of a spatial memory task. J Neurophysiol. 1996;76:1352–1355. - PubMed

Publication types

MeSH terms

LinkOut - more resources