. 1999 Jul 1;19(13):5514-27.
doi: 10.1523/JNEUROSCI.19-13-05514.1999.

Optic flow input to the hippocampal formation from the accessory optic system

Affiliations

Optic flow input to the hippocampal formation from the accessory optic system

D R Wylie et al. J Neurosci. .

Abstract

Recent studies in rodents have implicated the hippocampal formation in "path integration": the ability to use self-motion cues (ideothesis) to guide spatial behavior. Such models of hippocampal function assume that self-motion information arises from the vestibular system. In the present study we used the retrograde tracer cholera toxin subunit B, the anterograde tracer biotinylated dextran amine, and standard extracellular recording techniques to investigate whether the hippocampal formation [which consists of the hippocampus proper and the area parahippocampalis (Hp/APH) in pigeons] receives information from the accessory optic system (AOS). The AOS is a visual pathway dedicated to the analysis of the "optic flow fields" that result from self-motion. Optic flow constitutes a rich source of ideothetic information that could be used for navigation. Both the nucleus of the basal optic root (nBOR) and nucleus lentiformis mesencephali of the AOS were shown to project to the area ventralis of Tsai (AVT), which in turn was shown to project to the Hp/APH. A smaller direct projection from the nBOR pars dorsalis to the hippocampus was also revealed. During extracellular recording experiments, about half of the cells within the AVT responded to optic flow stimuli. Together these results illustrate that the Hp/APH receives information about self-motion from the AOS. We postulate that this optic flow information is used for path integration. A review of the current literature suggests that an analogous neuronal circuit exists in mammals, but it has simply been overlooked.


Figures
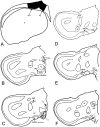
Fig. 1.
Fig. 1.
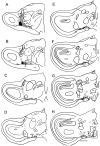
Retrograde labeling in the area ventralis of Tsai (AVT) after a bilateral injection of cholera toxin subunit B (CTB) in the hippocampus and area parahippocampalis (Hp/APH). A–F, Drawings of serial sections showing the location of the injection site and retrogradely labeled cells after pressure injection of CTB. The sections shown in B–Fare ∼275 μm apart. As can be seen in A, the injection included both Hp and APH, and in general, labeling after this injection conformed to the results shown by Casini et al. (1986). Retrograde labeling in the AVT was heaviest near the third cranial nerve (III), with retrogradely labeled cells found lateral, dorsal, and medial to III and between stria of III (as seen in C). Also note the presence of a few labeled cells in the nucleus of the basal optic root pars dorsalis (nBORd), indicating a small direct projection from this area to the hippocampal formation (C, F).CtG, Central gray; D, nucleus Darkschewitsch; Hy, hypothalamus;nBORl/p, nBOR lateralis/proper; MPv, nucleus mesencephalicus profundus pars ventralis; N, neocortex; Ov, nucleus ovoidalis; PT, nucleus pretectalis; QF, tractus quintofrontalis;RF, mesencephalic reticular formation;Rt, nucleus rotundus; Ru, nucleus ruber;SCI, stratum cellulare internum; SOp, stratum opticum; SP, nucleus subpretectalis;SpM/l, nucleus spiriformis medialis/lateralis;SRt, nucleus subrotundus. Scale bar, 1 mm.
Fig. 2.
Fig. 2.
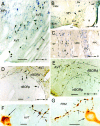
A, B, Photomicrographs of retrograde-labeled cells in the area ventralis of Tsai (AVT) after injection of cholera toxin subunit B (CTB) in the hippocampus and parahippocampalis. The small arrows indicate individual cells, and the larger arrows indicate groups of several cells. Note the cells labeled in the nucleus of the basal optic root pars dorsalis (nBORd) and between stria of the third cranial nerve (III). C, Retrograde-labeled cells in the pretectum after iontophoretic injection of CTB in the AVT. Thearrows indicate retrogradely labeled neurons, and thedotted lines show the boundaries between the pretectal nuclei. GT, Griseum tectale; LMl/m, nucleus lentiformis mesencephali lateralis/medialis;LPC, nucleus laminaris precommissuralis; PPC, nucleus principalis precommissuralis. Labeling was heaviest in LMl. D, E, Retrograde labeling in the ipsilateral and contralateral nBOR, respectively, after injection of CTB into AVT. Labeling after such injections was heaviest in the dorsal portions of nBOR proper (nBORp) and the adjacent nBORd. F, G, Anterograde-labeled fibers from nBOR terminating on or near retrograde-labeled cells in the AVT and medial mesencephalic reticular formation (FRM) after a double labeling study. The visualization procedure, described by Wild (1993), stains the CTB-labeled cells light brown, whereas the BDA-labeled fibers appear dark brown orblack. l, Lateral; m, medial. Scale bars: A, B, D, E, 100 μm;C, 50 μm; F, G, 10 μm.
Fig. 3.
Fig. 3.
Anterograde labeling in the area ventralis of Tsai (AVT) after injection of biotinylated dextran amine (BDA) into the pretectal nucleus lentiformis mesencephali (LM). A–H, Series of drawings (rostral to caudal, 250 μm apart) from case LM5 illustrating the injection site and terminal labeling in the AVT. The injection site is indicated by the blackened region (A, B), and the dots represent the locations of terminal labeling. See Results for additional details. DLL, Nucleus dorsolateralis anterior thalami pars lateralis;GLv, nucleus geniculatus lateralis pars ventralis;IOT, isthmo-optic tract; SCE, stratum cellulare externum; TeO, optic tectum;TrO, tractus opticus; TT, tractus tectothalamicus. See legends to Figures 1 and 2 for other abbreviations. Scale bar, 1 mm.
Fig. 4.
Fig. 4.
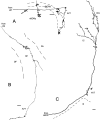
A, B, Anterogradely labeled fibers, reconstructed from serial sections, that projected from the nucleus lentiformis mesencephali (LM) to the area ventralis of Tsai (AVT). The fiber inA projected heavily to the nucleus of the basal optic root (nBOR), but a collateral penetrated the AVT. The fiber in B descended through the reticular formation (RF) where it branched and left terminals, but the parent fiber continued ventrally and terminated in the AVT.C shows an anterogradely labeled fiber projecting from the nBOR to the AVT. This fiber projected heavily to nucleus ruber (Ru) and the accessory oculomotor area [interstitial nucleus of Cajal (IC), and the central gray (CtG)], structures that are involved in postural and oculomotor control. A collateral terminated in the AVT. See legend to Figure 1 for other abbreviations. Scale bars, 60 μm.
Fig. 5.
Fig. 5.
Retrograde labeling in the accessory optic system after injection of CTB into the area ventralis of Tsai (AVT). A–F, Drawings of serial sections (caudal to rostral, 300 μm apart) illustrating the injection site and retrograde labeling in the nucleus of the basal optic root (nBOR) and pretectum from case AVT3. Note that the injection site, represented by the blackened area inA, did not include the nearby nucleus ruber (Ru). Labeling in the nBOR was heaviest in dorsal nBOR proper (nBORp) and the adjacent nBOR dorsalis (nBORd). Labeling in the pretectum was heaviest in the lateral subnucleus of lentiformis mesencephali (LMl), whereas little labeling was found in the medial LM (LMm) or other areas of the pretectum.Gt, Griseum tectale. See legends to Figures 1-3 for other abbreviations. Scale bar, 1 mm.
Fig. 6.
Fig. 6.
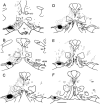
Results of a double labeling experiment.A–F, Drawings of serial sections (rostral to caudal, ∼130 μm apart) through the area ventralis of Tsai (AVT) from case DL2. The small gray dots represent the locations of anterograde terminals from an injection of biotinylated dextran amine (BDA) into the left nBOR (shaded black). The larger black dotsrepresent retrograde-labeled cell bodies from a bilateral injection into the hippocampal formation. Note the overlap of terminal labeling and retrogradely labeled cell bodies in the AVT. See Results for additional details. See legends to Figures 1 and 3 for additional abbreviations. Scale bar, 1 mm.
Fig. 7.
Fig. 7.
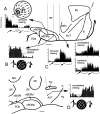
Responses of neurons in the nucleus of the basal optic root (nBOR) and area ventralis of Tsai (AVT) to large-field visual stimulation. This figure shows the locations (black circles) of four isolated neurons, all from the same bird, and their responses to large-field stimulation (A–D). The locations are shown on two serial sections through the basal mesencephalon. The upper section was located ∼0.5 mm caudal to the lower section. Thebroken vertical lines indicate the electrode tracks. The neurons shown in B and D had large monocular receptive fields in the contralateral eye. The PSTHs show the responses to large-field motion oscillating upward and downward (2.5 sec up, 2.5 sec down) in the contralateral hemifield. The broken horizontal lines represent the spontaneous rates. The neuron inB, which was located in the nBOR proper (nBORp), was maximally excited by upward large-field motion and inhibited by downward motion. The neuron inD, which was located in the rostral AVT, had the opposite direction preference. The neurons shown in Aand C had binocular receptive fields and preferred horizontal large-field motion in both hemifields. The PSTHs show the responses of these neurons to a translational flow field simulating self-translation of the bird along the z-axis (i.e., forward and backward self-translation). In A a schematic of the flow field that results in self-translation backward along thez-axis is shown. It is best described as forward optic flow contracting to a point directly in front. For each sweep the sequence was as follows: (1) ∼5 sec of backward optic flow (which would result from forward translation), (2) a 5 sec pause (broken line), (3) 5 sec of forward optic flow, (4) a 5 sec pause. In A and C the responses to binocular stimulation are shown. The responses to monocular stimulation of the ipsilateral and contralateral hemifields are also shown for the neuron in C. The neuron in A, which was located in the nBOR dorsalis (nBORd) was maximally excited/inhibited by backward/forward optic flow along this axis. The neuron in C, which was found in the AVT, showed the opposite direction preference. Note that greater modulation occurred under conditions of binocular viewing, compared with stimulation of either eye alone. See legends to Figures 1 and 3 for additional abbreviations. Scale bars, 300 μm.

Similar articles

Cited by

References

    1. Arends JJA, Zeigler HP. Organization of the cerebellum in the pigeon (Columba livia): II. Projections of the cerebellar nuclei. J Comp Neurol. 1991;306:245–272. - PubMed
    1. Bingman VP, Yates G. Hippocampal lesions impair navigational learning in experienced homing pigeons. Behav Neurosci. 1992;106:229–232. - PubMed
    1. Bingman VP, Ioale P, Casini G, Bagnoli P. The avian hippocampus: evidence for a role in the development of the homing pigeon navigational map. Behav Neurosci. 1990;104:906–911. - PubMed
    1. Blair HT, Sharp PE. Visual and vestibular influences on head-direction cells in the anterior thalamus of the rat. Behav Neurosci. 1996;110:643–660. - PubMed
    1. Brecha N, Karten HJ, Hunt SP. Projections of the nucleus of basal optic root in the pigeon: an autoradiographic and horseradish peroxidase study. J Comp Neurol. 1980;189:615–670. - PubMed

Publication types

MeSH terms