. 1999 Jul 1;19(13):5602-18.
doi: 10.1523/JNEUROSCI.19-13-05602.1999.

Binocular neurons in V1 of awake monkeys are selective for absolute, not relative, disparity

Affiliations

Binocular neurons in V1 of awake monkeys are selective for absolute, not relative, disparity

B G Cumming et al. J Neurosci. .

Abstract

Most neurophysiological accounts of disparity selectivity in neurons of the primary visual cortex (V1) imply that they are selective for absolute retinal disparities. By contrast, a number of psychophysical observations indicate that relative disparities play a more important role in depth perception. During recordings from disparity selective neurons in area V1 of awake behaving monkeys, we used a disparity feedback loop () to add controlled amounts of absolute disparity to a display containing both absolute and relative disparities. This manipulation changed the absolute disparity of all the visible features in the display but left unchanged the relative disparities signalled by these features. The addition of absolute disparities produced clear changes in the neural responses to unchanged external stimuli, which were well predicted by the measured change in absolute disparity: in 45/53 cases, the neuron maintained a consistent firing pattern with respect to absolute disparity so that the manipulation created no significant change in the absolute disparity preferred by the neuron. No neuron in V1 maintained a consistent relationship with relative disparity. We conclude that the relative disparity signals used in primate depth perception are constructed outside area V1.


Figures

Fig. 1.
Fig. 1.
Diagram illustrating relative and absolute disparities of two points in different depth planes. If the vergence angle changes, the absolute disparity associated with each point changes. On the left, the more distant dot is fixated and has an absolute disparity of zero. The near dot then projects to noncorresponding retinal locations and thus has an absolute disparity, arbitrarily assigned 1 unit here. If the depth of fixation changes (right), the absolute disparity of both dots changes (to ±½ here). The difference in absolute disparity between the dots is unchanged and is termed their relative disparity.
Fig. 2.
Fig. 2.
Example of random dot stimulus shown for free fusion.
Fig. 3.
Fig. 3.
Diagram illustrating the effect of an absolute disparity clamp on two stimulus configurations. Each panelshows a plan view of the two eyes of a subject who is required to fixate the cross while a random dot stereogram (RDS) is presented to the left of the fixation point. The RDS is depicted as the set of thick lines parallel to the interocular axis. Note that the background of the RDS is always at the same location in depth as the binocular fixation marker, whereas the central region of the RDS may be altered in disparity. The ellipse shows the position of an idealized neuronal receptive field, shown at a fixed absolute disparity of 0°. Note that therefore the receptive field is always depicted at the convergence point of the eyes, not at a fixed three-dimensional location relative to the head. Each panel shows a different combination of absolute disparity, either zero or crossed (near), and relative disparity, also either zero or crossed. InA and C, the RDS shows a single planar surface at the same depth as the fixation marker, but in C the clamp has placed the central region of the RDS at a crossed absolute disparity. In B and D, the central region of the RDS is distinguished by a disparity relative to the surround region, and relative to the fixation marker, but in D the clamp has placed this central region at an absolute disparity of zero. So a neuron selective for zero absolute disparity would respond to configurations A and D, whereas a neuron responding to zero disparity relative to the other visible features would respond to configurations A andC.
Fig. 4.
Fig. 4.
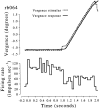
Eye movement records during a period of steady binocular fixation followed by a period in which an additional absolute disparity was imposed by a feedback loop based on measured vergence angle (two sequential trials taken while recording the data shown in Figs. 6-9 below). The dashed line shows the vergence stimulus calculated from the recorded positions of the two haploscope mirror servos; the solid lines show the measured vergence response. For the first 1 sec of each trial, the vergence stimulus is constant. In the left panel, this vergence stimulus is at a relatively diverged position. After 1 sec, the mirrors of the haploscope rotate, placing the fixation marker in front of the point of convergence (by 0.2° in this case). After a reaction time, the animal begins to converge to regain binocular fixation, but the measured vergence position is used to rotate the mirrors further, to maintain the additional absolute disparity of the fixation marker. Thus the disparity of the fixation marker is clamped to the preselected value for a period of 1 sec. Throughout the whole of the 2 sec trial, the same stimulus is presented on the CRT monitors. Note that there is a change in vergence with no systematic change in the conjugate eye position (dotted line, positive values indicate leftward movement, scale at right-hand side of figure). Also, small changes in conjugate eye position are not associated with changes in vergence. Spikes were counted from 50 msec after the beginning of each period, and disparity tuning curves were constructed separately for four conditions: (1) Far Fixation, (2)Crossed clamp, (3) Near Fixation, (4)Uncrossed clamp.
Fig. 5.
Fig. 5.
Vergence eye movements from three individual trials with a nominal disparity clamp of 0.2°. The top andbottom traces show examples of trials in which the velocity of the vergence movement caused the trial to be excluded from the analysis. The central trace shows a trial in which the vergence velocity was near the mean for this animal and this clamp size. In the bottom trial, the animal appears to be underconverged during the fixation period, and this is followed by a relatively slow convergence ramp. This is to be expected if the measured underconvergence is an instrumental artifact. If convergence is underestimated, the real clamp applied will be smaller than that measured. Similarly, the top trace shows initial overconvergence and a relatively fast ramp.
Fig. 6.
Fig. 6.
Effects of the feedback loop on activity of one disparity-selective neuron. The stimulus throughout was presented at a disparity of 0.2° relative to the fixation marker, the preferred disparity when tested during steady fixation. When the absolute disparity of the fixation marker is changed (by 0.172° created by setting a target disparity clamp of 0.2°; see Materials and Methods and Fig. 7), so that the absolute disparity of the stimulus is 0.372°, the firing rate drops immediately, although the relative disparity is unchanged. Average of five trials.
Fig. 7.
Fig. 7.
Disparity tuning curves for the cell illustrated in Figure 6. The data were collected during the imposition of two different, additional absolute disparities. The left panelshows the data plotted in terms of relative disparity (the disparity of the stimulus within the receptive field relative to the fixation marker). A frequency histogram is also shown for the measured absolute disparity of the fixation marker during each clamp. The right panel shows the neural data replotted in terms of absolute disparity (the disparity of the stimulus with respect to retinal landmarks such as the fovea). Each tuning curve from the left panel has simply been moved horizontally by the mean measured absolute disparity value for the respective clamp condition.
Fig. 8.
Fig. 8.
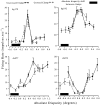
Disparity tuning functions for four units, plotted as a function of absolute disparity. Two units from each monkey are shown. Various tuning types [as identified by Poggio and Fisher (1977); Poggio (1995)] are represented: TE/T0 cells (top row, showing a maximal response to disparities near zero), a Near cell (bottom left, showing a stronger response to near disparities than to far disparities), and a TI cell (bottom right, suppressed by near-zero disparities). The solid bar in each graph indicates the size of the absolute disparity shift produced by the clamp. Shifting the solid symbols by this distance to the left would align the responses in terms of relative disparity. In all cases, there is a consistent relationship to absolute, not relative, disparity.
Fig. 9.
Fig. 9.
Gabor functions fitted to the tuning data shown in Figure 7. To begin, two Gabor functions are fitted, one to each clamp condition; that is, one Gabor for the additional absolute disparity with a positive value and another Gabor for the one with a negative value. The parameters of the two Gabor functions are identical, except for a horizontal translation. The magnitude of the horizontal translation then gives a measure of how consistently the neuron relates to a given experimental variable. Clearly, the relationship to relative disparity (left) is not consistent, because there is a substantial horizontal shift in the curve when the absolute disparity is changed. Furthermore, the size of the horizontal shift measured from the fitted curves (−0.363°) is very similar to the measured difference in additional absolute disparity between the two conditions (−0.339°). Consequently, when the data are expressed in terms of absolute disparity and the same comparisons are made, the fitted shift is very small (0.024°). The significance of these shifts can be assessed by comparing the goodness of fit of the linked pair of Gabor functions with a single Gabor that attempts to describe the combined data set. Adding the horizontal shift increases the number of parameters by one. On the left, the single Gabor is clearly a poor fit (dotted line); the addition of the horizontal shift to create a pair of linked Gabor functions improves the fit (F(1,86) = 408, p < 0.00001). On the right, using the pair of linked Gabor functions does not significantly improve the fit (F(1,86) = 3.0, p >0.05) compared with a single Gabor. (In fact, the fit with a single Gabor is so similar to the two illustrated curves that it is not shown separately.) It can be concluded that the firing rate bears a consistent relationship to absolute disparity regardless of the added disparity clamp.
Fig. 10.
Fig. 10.
Comparison of goodness of fit of a single Gabor function fitted to relative disparity or absolute disparity tuning functions. The fraction of the total variance accounted for by a single Gabor fit to the mean firing rates as a function of disparity was calculated. Note that both fits have the same number of free parameters. Cells shown with open symbols are those for which tuning curves are shown elsewhere. For all 53 cells, fitting a Gabor to the absolute disparity data produces a better description than a fit to the relative disparity data: all cells maintained a more consistent relationship to absolute disparity than to relative disparity. For points far away from the identity line (solid line), this difference was large. Points might fall close to the identity line for several reasons. (1) If the shift in absolute disparity is small compared with the disparity bandwidth of the cell (see rb073, Fig. 8, bottom right), then both fits will be good. (2) For Near/Far cells, if only one or two data points fall on the sharply changing region of the tuning function (the only region affected by the clamp), neither fit need be very poor (see rb077, Fig.8; hg197, Fig. 16). (3) If there is a shift in preferred relative disparity, but this shift is not equal to the absolute disparity measured from eye and mirror position records, then the fit to both relative and absolute disparities will be imperfect (rb073 in Fig. 8 is an example where the shift in the tuning curves appears slightly less than the measured shift). (4) If a single Gabor function is a poor description of the disparity tuning curve, both fits will be poor, typically because either the neurons are only weakly modulated by disparity or there is a change in the shape of tuning curve between the two clamp conditions (hg178, Fig. 17).
Fig. 11.
Fig. 11.
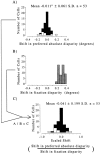
Frequency histograms showing the distribution of (A) shifts in preferred absolute disparity, (B) shifts in measured absolute disparity of the fixation marker (fixation disparity), and (C) the ratio of these measures, termed scaled shift. For each neuron, the tuning to absolute disparities was fitted with a pair of Gabors differing only in their horizontal position, and the shift between the two Gabors was calculated (the shift in absolute disparity preference). For the same set of trials, the actual size of the absolute disparity clamp was calculated from records of mirror and eye position, and the difference between the two clamp conditions was calculated (shift in fixation disparity). The ratio of these measures (scaled shift) gives a measure of the extent to which disparity preference was influenced by the clamp. Values of zero correspond to a consistent relationship with absolute disparity. If a neuron maintained a consistent relationship to relative disparity, then the tuning when plotted in terms of absolute disparity should shift by a disparity exactly equal to the change in absolute disparity, giving a scaled shift of 1.0. The eight units shown in white had significant alterations in their selectivity for absolute disparity under the two clamp conditions. Note that values of 0 do not arise simply because there is no measurable change in disparity selectivity; rather, they arise when the change in response to a stimulus of fixed relative disparity is exactlyexplained by the measured change in absolute disparity produced by the clamp.
Fig. 12.
Fig. 12.
Effects of vergence changes on disparity tuning index for the 53 neurons studied here. The tuning index is similar at both fixation distances. The solid line is the identity line.
Fig. 13.
Fig. 13.
Effects of change in mean vergence on disparity selectivity for one neuron. The stimulus disparity plotted is the relative disparity between the foreground and the fixation marker (because there was no controlled manipulation of the absolute disparity). As in Figure 7, the absolute disparity of the fixation marker (i.e., fixation disparity) was calculated for each trial, and frequency histograms for this are shown in the top panel. There is a small difference in the mean fixation disparity at the two vergence angles, and this is reflected by a similar shift in the disparity tuning when expressed in terms of relative disparity. The direction of the shift corresponds to that predicted on the basis that the neuron is fundamentally selective for absolute disparity.
Fig. 14.
Fig. 14.
Effects of change in mean vergence on disparity selectivity for a neuron from monkey Hg. In this animal, changes in the vergence stimulus induced larger changes in fixation disparity than for monkey Rb. The relative disparity tuning curves also tended to show larger shifts, as shown here.
Fig. 15.
Fig. 15.
Scatterplot showing relationship between measured change in fixation disparity and fitted shift in disparity tuning for each cell. Most of the shifts are in the same direction (positive) for both parameters. Thus these data clearly indicate that on average the animals underconverged for near targets, and the absolute disparity that this adds to the stimuli is reflected in the cell firing. There is also a weak but significant (0.01 < p < 0.05) correlation between the two shifts. This correlation is also significant in the data for Monkey Hg alone, which shows a wider scatter and a larger mean change (for both fixation disparity and disparity tuning). The correlation is not significant in the data forMonkey Rb alone.
Fig. 16.
Fig. 16.
Summary of responses under all four conditions studied, for four different units. For each neuron, four disparity tuning functions are shown, corresponding to the four conditions shown in Figure 4. In each case, the measured disparity of the fixation marker has been added to the stimulus relative disparity, to estimate the absolute disparity of the stimulus within the receptive field. The magnitude of the shift in absolute disparity produced by the clamps is shown by the solid bars. If the neurons were selective for relative disparity, the tuning curves for the two clamp conditions should appear displaced horizontally by this distance. In both monkeys, and for all types of tuning (T0/TE, Near/Far, T1), neurons show a consistent relationship to absolute disparity.
Fig. 17.
Fig. 17.
A, Disparity tuning of one neuron whose response rate was substantially altered by changes in vergence angle. For this reason, fitting the absolute disparity tuning data with a single Gabor gave a poor fit (the worst in our entire data set; see Fig. 10). The apparent effect of vergence could be the result of underestimating the size of the receptive field, because changes in fixation disparity produce changes in the absolute disparity of the surround region of the stimulus (B). If this surround region were to encroach on the receptive field, then the change in fixation disparity would alter the absolute disparity of stimuli within the RF and hence alter neuronal firing. Note that the direction of the change in firing rate fits with this explanation. The neuron is tuned to small crossed disparities, which is the type of fixation disparity produced by near fixation (during which firing is greater). This explanation is also supported by the fact that the tuning during uncrossed clamps closely resembled that during far fixation. Similarly, tuning during crossed clamps resembled that during near fixation.

Similar articles

Cited by

References

    1. Barlow H, Blakemore C, Pettigrew J. The neural mechanisms of binocular depth discrimination. J Physiol. 1967;193:327–342. - PMC - PubMed
    1. Bishop PO, Henry GH. Spatial vision. Annu Rev Psychol. 1971;22:119–160. - PubMed
    1. Brookes A, Stevens KA. The analogy between stereo depth and brightness. Perception. 1989;18:601–614. - PubMed
    1. Collewijn H, Erkelens C, Steinman R. Binocular co-ordination of human horizontal saccadic eye movements. J Physiol (Lond) 1988;404:157–182. - PMC - PubMed
    1. Cumming BG, Judge SJ. Disparity-induced and blur-induced convergence eye movement and accommodation in the monkey. J Neurophysiol. 1986;55:896–914. - PubMed

Publication types

LinkOut - more resources