

Receptor recruitment: a mechanism for interactions between G protein-coupled receptors
- PMID: 10377404
- PMCID: PMC22075
- DOI: 10.1073/pnas.96.13.7271
Receptor recruitment: a mechanism for interactions between G protein-coupled receptors
Abstract
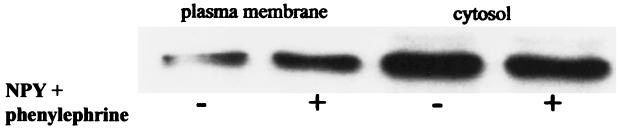
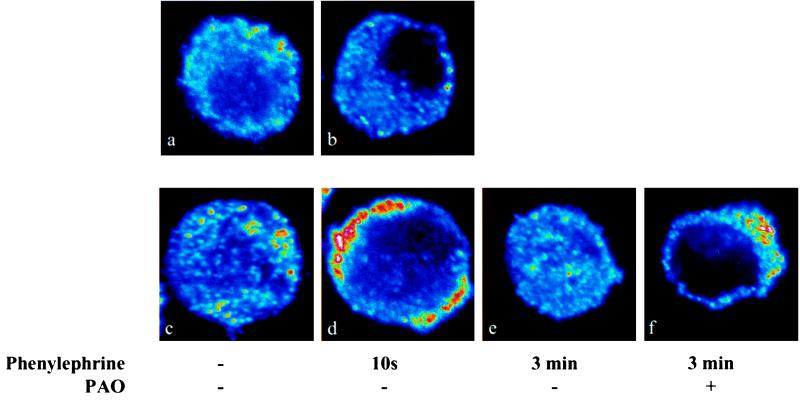
There is a great deal of evidence for synergistic interactions between G protein-coupled signal transduction pathways in various tissues. As two specific examples, the potent effects of the biogenic amines norepinephrine and dopamine on sodium transporters and natriuresis can be modulated by neuropeptide Y and atrial natriuretic peptide, respectively. Here, we report, using a renal epithelial cell line, that both types of modulation involve recruitment of receptors from the interior of the cell to the plasma membrane. The results indicate that recruitment of G protein-coupled receptors may be a ubiquitous mechanism for receptor sensitization and may play a role in the modulation of signal transduction comparable to that of the well established phenomenon of receptor endocytosis and desensitization.
Figures
Similar articles
-
Signaling pathways involved in atrial natriuretic factor and dopamine regulation of renal Na+, K+ -ATPase activity.Regul Pept. 2007 Jan 10;138(1):26-31. doi: 10.1016/j.regpep.2006.08.001. Epub 2006 Sep 26. Regul Pept. 2007. PMID: 17005263
-
Analysis of Na+,K+-ATPase motion and incorporation into the plasma membrane in response to G protein-coupled receptor signals in living cells.Mol Biol Cell. 2003 Mar;14(3):1149-57. doi: 10.1091/mbc.e02-06-0367. Mol Biol Cell. 2003. PMID: 12631730 Free PMC article.
-
Maturation of rat renal tubular response to alpha-adrenergic agonists and neuropeptide Y: a study on the regulation of Na+,K+-ATPase.Pediatr Res. 1996 Mar;39(3):534-8. doi: 10.1203/00006450-199603000-00024. Pediatr Res. 1996. PMID: 8929877
-
Sodium-potassium-adenosinetriphosphatase-dependent sodium transport in the kidney: hormonal control.Physiol Rev. 2001 Jan;81(1):345-418. doi: 10.1152/physrev.2001.81.1.345. Physiol Rev. 2001. PMID: 11152761 Review.
-
Regulation of renal tubular sodium transport by angiotensin II and atrial natriuretic factor.Clin Exp Pharmacol Physiol Suppl. 1996;3:S112-8. Clin Exp Pharmacol Physiol Suppl. 1996. PMID: 8993849 Review.
Cited by
-
G-protein coupled receptor resensitization-appreciating the balancing act of receptor function.Curr Mol Pharmacol. 2012 May 30. Online ahead of print. Curr Mol Pharmacol. 2012. PMID: 22697395 Free PMC article.
-
Intrarenal angiotensin III infusion induces natriuresis and angiotensin type 2 receptor translocation in Wistar-Kyoto but not in spontaneously hypertensive rats.Hypertension. 2009 Feb;53(2):338-43. doi: 10.1161/HYPERTENSIONAHA.108.124198. Epub 2008 Dec 15. Hypertension. 2009. PMID: 19075092 Free PMC article.
-
Escorts take the lead molecular chaperones as therapeutic targets.Prog Mol Biol Transl Sci. 2010;91:121-49. doi: 10.1016/S1877-1173(10)91005-3. Prog Mol Biol Transl Sci. 2010. PMID: 20691961 Free PMC article. Review.
-
CXCR7 protein expression in human adult brain and differentiated neurons.PLoS One. 2011;6(5):e20680. doi: 10.1371/journal.pone.0020680. Epub 2011 May 31. PLoS One. 2011. PMID: 21655198 Free PMC article.
-
Nuclear Na+/K+-ATPase plays an active role in nucleoplasmic Ca2+ homeostasis.J Cell Sci. 2012 Dec 15;125(Pt 24):6137-47. doi: 10.1242/jcs.114959. Epub 2012 Oct 17. J Cell Sci. 2012. PMID: 23077175 Free PMC article.
References
-
- Illes P, Regenholt J T. Nature (London) 1990;344:62–63. - PubMed
-
- Noel M B, Gratton A. Synapse. 1995;21:110–122. - PubMed
-
- Ohtomo Y, Meister B, Hökfelt T, Aperia A. Kidney Int. 1994;45:1606–1613. - PubMed
-
- Holtbäck U, Ohtomo Y, Förberg P, Sahlgren B, Aperia A. Am J Physiol. 1998;275:F1–F7. - PubMed
-
- Katoh T, Sophasan S, Kurokawa K. Am J Physiol. 1989;257:F300–F309. - PubMed
Publication types
MeSH terms
Substances
Grants and funding
LinkOut - more resources
Full Text Sources
Research Materials
