. 1999 Jun 22;96(13):7439-44.
doi: 10.1073/pnas.96.13.7439.

Induction of differentiation of pre-NKT cells to mature Valpha14 NKT cells by granulocyte/macrophage colony-stimulating factor

Affiliations

Induction of differentiation of pre-NKT cells to mature Valpha14 NKT cells by granulocyte/macrophage colony-stimulating factor

H Sato et al. Proc Natl Acad Sci U S A. .

Abstract

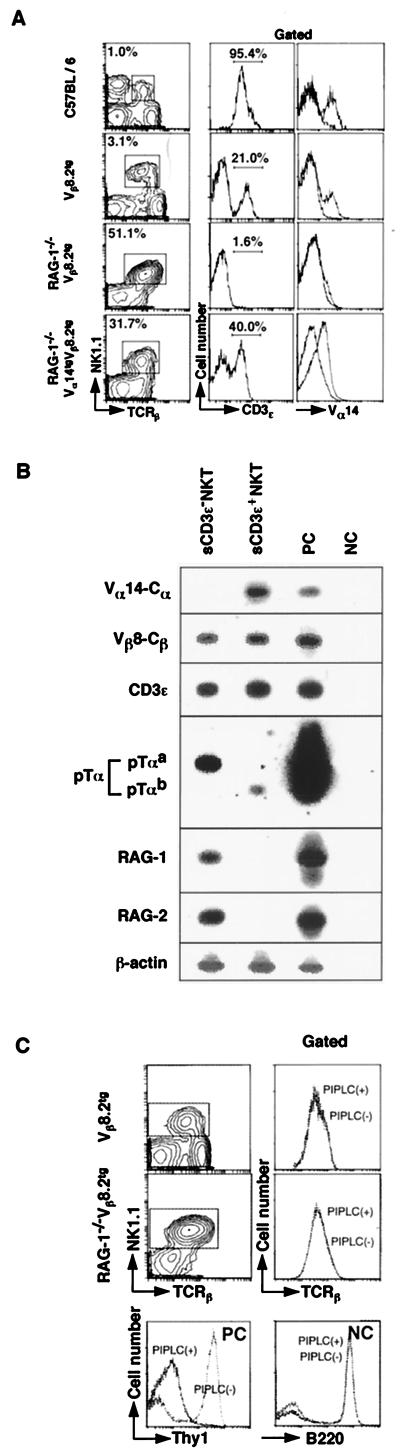
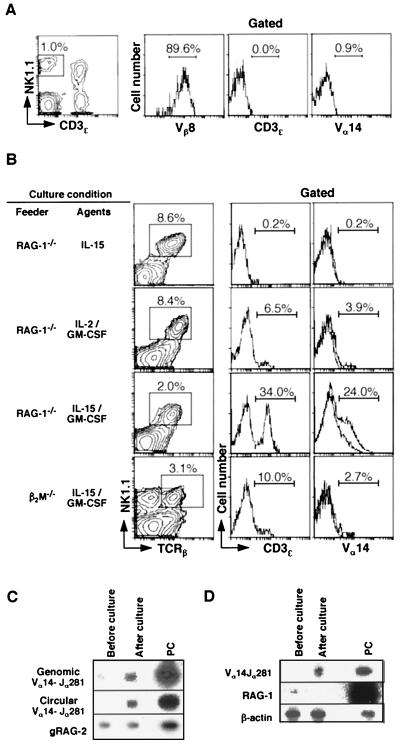
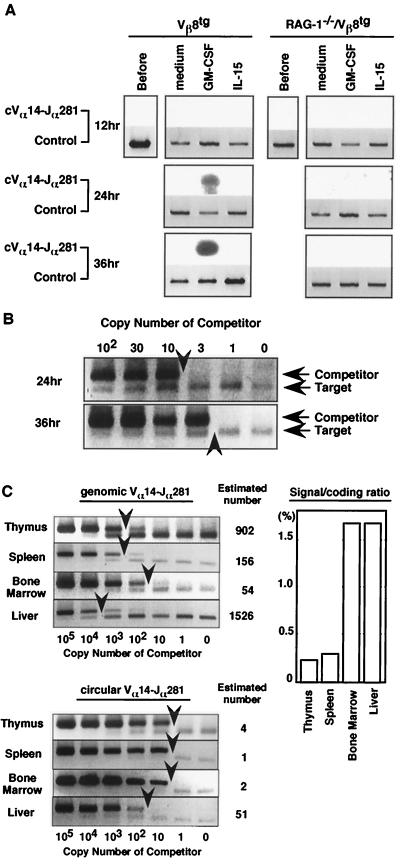
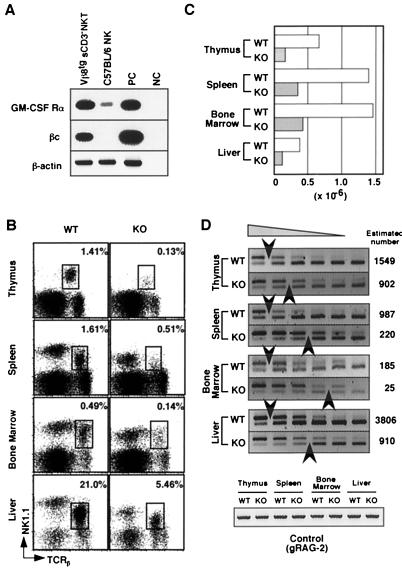
Valpha14 NKT cells express an invariant antigen receptor encoded by Valpha14 and Jalpha281 gene segments as well as natural killer (NK) markers, including NK1.1. Here, we describe a precursor population of NKT cells (pre-NKT) that expresses NK1.1, T cell antigen receptor beta, pTalpha, and RAG1/2 but not Valpha14 and surface CD3epsilon. Such pre-NKT cells were differentiated successfully in vitro into mature CD3epsilon+ Valpha14(+) NKT cells by IL-15 and granulocyte/macrophage colony-stimulating factor (GM-CSF) in conjunction with stroma cells. Interestingly, only GM-CSF without stroma cells induced the Valpha14-Jalpha281 gene rearrangement in the pre-NKT cells. This also was confirmed by the findings that the number of mature Valpha14 NKT cells and the frequency of Valpha14-Jalpha281 rearrangements were decreased significantly in the mice lacking a GM-CSF receptor component, common beta-chain. These results suggest a crucial role of GM-CSF in the development of Valpha14 NKT cells in vivo.


Figures

Figure 1
Figure 1
Characterization of sCD3ɛ NKT cells by flow cytometric analysis and RT-PCR. (A) Spleen cells from C57BL/6, Vβ8.2tg, RAG-1−/− Vβ8.2tg, and RAG-1−/− Vα14tgVβ8.2tg mice were stained with antibodies against TCRβ, NK1.1, and either CD3ɛ or Vα14. The profiles of CD3ɛ and Vα14 expression on the gated NKT cells (TCRβ+NK1.1+ cells) are shown. The percentage of gated cells is shown in for each profile. (B) RT-PCR analysis of sCD3ɛ NKT and sCD3ɛ+ NKT cells. BM cells from Vβ8.2tg mice were fractionated into CD3ɛ and CD3ɛ+ NKT cells by a cell sorter, and RT-PCR was carried out. PC, C57BL/6 thymocytes; NC, mock. (C) Effect of PIPLC on surface expression of TCRβ on TCRβ+NK1.1+ cells of Vβ8.2tg and RAG-1−/−Vβ8.2tg mice. Vβ8.2tg and RAG-1−/− Vβ8.2tg spleen cells were treated with or without PIPLC and then stained with anti-TCRβ and NK1.1 mAbs. The gated NKT cells were evaluated for surface TCRβ expression. For positive control (PC), C57BL/6 spleen cells with or without PIPLC were examined for surface expression of Thy-1.2. For negative control (NC), B220 expression was assessed.
Figure 2
Figure 2
Differentiation of sCD3 NKT cells into sCD3+ mature Vα14 NKT cells in vitro. (A) Flow cytometric profiles of purified sCD3ɛ NKT cells. sCD3ɛ NKT cells purified from the Vβ8.2tg mouse BM were assessed for their expression of Vβ8, CD3ɛ, and Vα14. (B) Generation of sCD3ɛ+ mature Vα14 NKT cells from sCD3ɛ pre-NKT cells in vitro. Sorted sCD3ɛ NKT cells (2 × 10⁴) from Vβ8.2tg BM cells were cocultured for 5 days with RAG-1−/− or β2m−/− BM feeder cells (2.0 × 10⁶) in the presence of indicated cytokines. The cells were stained with mAbs against TCRβ, NK1.1, and either CD3ɛ or Vα14 TCR. The percentages of CD3ɛ+ and Vα14+ cells are indicated in each profile. (C) Genomic PCR for the detection of coding (genomic Vα14-Jα281) and signal (circular Vα14-Jα281) joints of Vα14-Jα281 gene rearrangement after culture. Cells harvested before (at the onset) and after culture were examined for gene rearrangement by detection of coding and signal joints generated from Vα14-Jα281 gene recombination. RAG-2 (gRAG-2) was used as input DNA control. (D) RT-PCR analysis of mRNAs for Vα14 TCR and RAG-1 using the same samples as in A. β-Actin was used as a control. PC, C57BL/6 thymocytes.
Figure 3
Figure 3
Induction of Vα14 gene rearrangement events in sCD3ɛ pre-NKT cells by GM-CSF. (A) Genomic PCR analysis of circular Vα14-Jα281 extrachromosomal DNA. The sCD3ɛNKT cells collected were cultured and harvested at time points indicated. Similar results were obtained in four independent experiments. RAG-2 DNA (Control) was used as input DNA control. (B) Competitive-PCR analysis of the amounts of circular Vα14-Jα281 DNA in sCD3ɛ NKT cells. The copy numbers of circular Vα14-Jα281 DNA at 24- and 36-hr time points after culture were estimated by competitive PCR. The upper band represents amplified competitor DNA, and the lower one represents target DNA. Arrowheads indicate target DNA amounts estimated by comparing densities of competitor and target DNA bands. (C) Competitive-PCR analysis of genomic and circular Vα14-Jα281 DNA in freshly isolated tissues. Arrowheads indicate estimated DNA amounts. Numbers along the right indicate copy numbers of genomic and circular DNA estimated by measuring densities of competitor (upper band) and target DNA bands (lower band). The ratio of signal sequence to coding joint in each organ is shown in the graph (Right).
Figure 4
Figure 4
Expression of GM-CSF receptor in sCD3ɛ NKT cells and Vα14 NKT cell development in βc-deficient mice. (A) Total RNA was prepared from sorted Vβ8.2tg sCD3ɛ NKT and NK cells from C57BL/6 spleen, and the expressions of GM-CSFRα and βc were assessed by RT-PCR. β-Actin was used as input cDNA control. (B) TCRβ/NK1.1 profiles of NKT cells in wild-type (WT) and βc-deficient (KO) mice. The percentages of gated NKT cells are shown. Cells pooled from three animals were analyzed for each group. (C) Absolute numbers of NKT cells in each organ were calculated from flow cytometric profiles. (D) Competitive-PCR analysis of Vα14-Jα281 gene rearrangement in WT and KO mice. Genomic DNA (300 ng) were PCR-amplified with primers specific to Vα14 and Jα281 gene segments in the presence of a defined number of competitors serially diluted by 2-fold. The number of competitors in the first lane is 2,500 copies for thymus, 1,250 for spleen, 313 for BM, and 5,000 for liver. Arrowheads indicate estimated target DNA amounts as in Fig. 3B. The upper band represents amplified competitor DNA and the lower one represents the target DNA.

Similar articles

Cited by

References

    1. Lantz O, Bendelac A. J Exp Med. 1994;180:1097–1106. - PMC - PubMed
    1. Makino Y, Kanno R, Ito T, Higashino K, Taniguchi M. Int Immunol. 1995;7:1157–1161. - PubMed
    1. Makino Y, Kanno R, Koseki H, Taniguchi M. Proc Natl Acad Sci USA. 1996;25:6516–6520. - PMC - PubMed
    1. Cui J, Shin T, Kawano T, Sato H, Kondo E, Toura I, Kaneko Y, Koseki H, Kanno M, Taniguchi M. Science. 1997;278:1623–1626. - PubMed
    1. Taniguchi M, Koseki H, Tokuhisa T, Masuda K, Sato H, Kondo E, Kawano T, Cui J, Perkes A, Koyasu S, et al. Proc Natl Acad Sci USA. 1996;93:11025–11028. - PMC - PubMed

Publication types

LinkOut - more resources