. 1999 Jul 15;518 ( Pt 2)(Pt 2):469-78.
doi: 10.1111/j.1469-7793.1999.0469p.x.

Properties of Ca2+ sparks evoked by action potentials in mouse ventricular myocytes

Affiliations

Properties of Ca2+ sparks evoked by action potentials in mouse ventricular myocytes

J H Bridge et al. J Physiol. .

Abstract

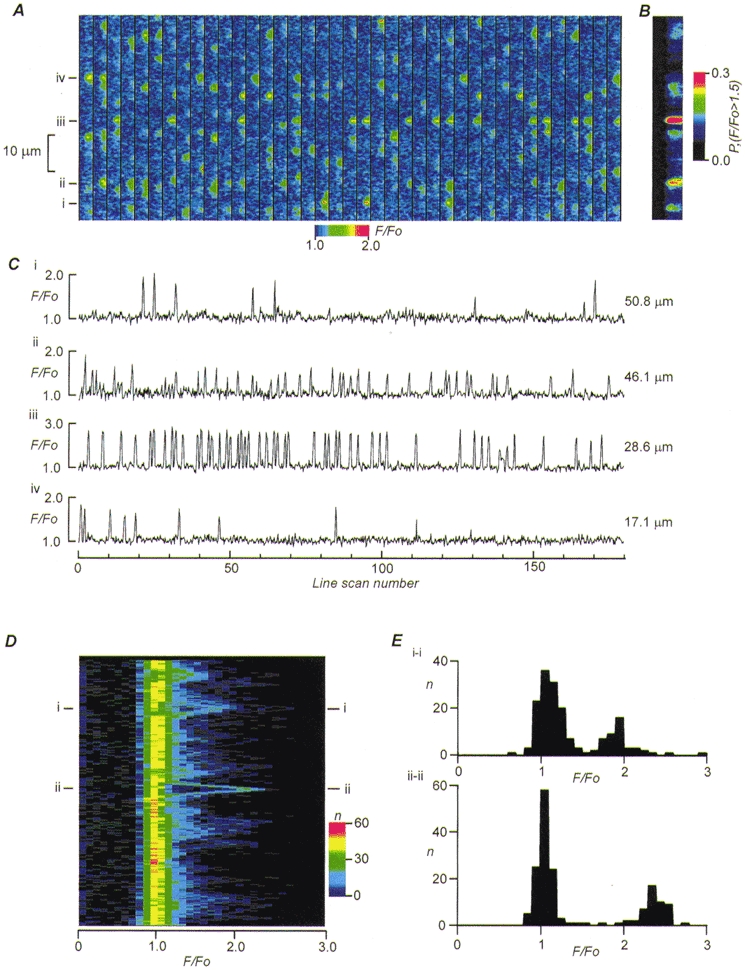
1. Calcium sparks were examined in enzymatically dissociated mouse cardiac ventricular cells using the calcium indicator fluo-3 and confocal microscopy. The properties of the mouse cardiac calcium spark are generally similar to those reported for other species. 2. Examination of the temporal relationship between the action potential and the time course of calcium spark production showed that calcium sparks are more likely to occur during the initial repolarization phase of the action potential. The latency of their occurrence varied by less than 1.4 ms (s.d.) and this low variability may be explained by the interaction of the gating of L-type calcium channels with the changes in driving force for calcium entry during the action potential. 3. When fixed sites within the cell are examined, calcium sparks have relatively constant amplitude but the amplitude of the sparks was variable among sites. The low variability of the amplitude of the calcium sparks suggests that more than one sarcoplasmic reticulum (SR) release channel must be involved in their genesis. Noise analysis (with the assumption of independent gating) suggests that > 18 SR calcium release channels may be involved in the generation of the calcium spark. At a fixed site, the response is close to 'all-or-none' behaviour which suggests that calcium sparks are indeed elementary events underlying cardiac excitation-contraction coupling. 4. A method for selecting spark sites for signal averaging is presented which allows the time course of the spark to be examined with high temporal and spatial resolution. Using this method we show the development of the calcium spark at high signal-to-noise levels.


Figures

Figure 1
Figure 1. Confocal images of a mouse ventricular myocyte stained with fluo-3
This figure shows 6 sequential images of the distribution of Ca2+ in a quiescent mouse ventricular cell. Note the local regions of elevated fluorescence (Ca2+ sparks) that vary position between images.
Figure 2
Figure 2. Line scan imaging during the action potential
A, fluorescence changes evoked by the mouse action potential. i, the action potential was elicited by a brief current injection. A stimulus artifact is apparent just before the upstroke of the action potential. The peak value for membrane potential (ordinate) is about +50 mV and the duration of the action potential is approximately 130 ms (abscissa). ii, a line scan plot of the change in fluorescence intensity that was activated by the action potential. Position along the line scan is plotted on the ordinate and time on the abscissa. The colour bar on the right indicates the fluorescence ratio (F/F0). F0 is the background intensity obtained by measuring fluorescence intensity before the stimulus. iii, the time course of the spatially averaged fluorescence change (F/F0) during the action potential. B, an expanded view of the relationship between the action potential and the spatially averaged Ca2+ transient depicted in A. The panel shows the time course of the action potential (i), the spatially averaged Ca2+ transient (ii), and the derivative of the upstroke of the Ca2+ transient which reaches a peak approximately 8 ms after the onset of the Ca2+ transient (iii). The dashed vertical lines delineate the period over which the majority of Ca2+ release takes place. Note the temporal relationship between the action potential and the upstroke of the calcium transient.
Figure 3
Figure 3. Line scan images of repeated stimuli
A, the panel shows 39 sequential line scan images (from a total of 180) taken during electrical stimulation. Each ‘strip’ (lasting 60 ms) shows the pattern of fluorescence change resulting from electrical stimulation, and the relative fluorescence change (F/F0) along the scan line is coded in colour (scale shown below the panel). Note that sparks occur at varying positions along the line scan and that every spark site does not respond to each stimulus. B, the plot indicates the probability of measuring a relative fluorescence intensity greater than 1·5 at each point along the scan line. C, traces of the fluorescence change for 180 images at the positions indicated in A. D, histogram analysis of fluorescence changes 8 ms after stimulation. Position along the scan line is plotted on the ordinate and relative fluorescence on the abscissa. The colour bar on the right indicates the number of times that a particular fluorescence ratio was measured. Most observations occur at F/F0=≈ 1·0 (which is background, implying no release took place). Chevron-like structures are particularly apparent at positions i and ii which point to regions that should be closest to spark centres (see text). E, two dimensional histograms of fluorescence intensities at position i and ii in D. In both histograms there are two distinct modal distributions of relative fluorescence intensity.
Figure 4
Figure 4. Signal-averaged Ca2+ spark
A, 20 sparks signal averaged from a fixed position and confocal plane. Sparks for averaging were selected by assuming that they were associated with a relative fluorescence change of > 1·5. B shows the derivative with respect to time of the fluorescence intensity of the spark depicted in A. Note the temporal similarity of the derivative of the spark to that of the whole-cell transient. C, profiles of relative fluorescence at various times (indicated on the traces) after the beginning of the spark. D, profiles of fluorescence intensity at various distances (indicated on the traces) from the centre of the spark. As the distance from the spark centre increases, the amplitude decreases and the time of rise increases.

Similar articles

Cited by

References

    1. Barcenas-Ruiz L, Wier WG. Voltage dependence of intracellular Ca2+ transients in guinea pig vetricular myocytes. Circulation Research. 1987;61:148–154. - PubMed
    1. Bers DM. Excitation-Contraction Coupling and Cardiac Contractile Force. Dordrecht: Kluwer; 1991.
    1. Blatter LA, Huser J, Rios E. Sarcoplasmic reticulum Ca2+ release flux underlying Ca2+ sparks in cardiac muscle. Proceedings of the National Academy of Sciences of the USA. 1997;94:4176–4181. - PMC - PubMed
    1. Bridge JHB, Li J, Ershler PR, Razusova Z, Cannell MB. Calcium sparks and evoked local calcium transients in mouse ventricular myocytes. Biophysical Journal. 1998;74:A118.
    1. Cannell MB, Berlin JR, Lederer WJ. Effect of membrane potential changes on the calcium transient in single rat cardiac muscle cells. Science. 1987;238:1419–1423. - PubMed

Publication types

LinkOut - more resources