

Non-chemical inhibition of respiratory motor output during mechanical ventilation in sleeping humans
- PMID: 10381605
- PMCID: PMC2269431
- DOI: 10.1111/j.1469-7793.1999.0605p.x
Non-chemical inhibition of respiratory motor output during mechanical ventilation in sleeping humans
Abstract
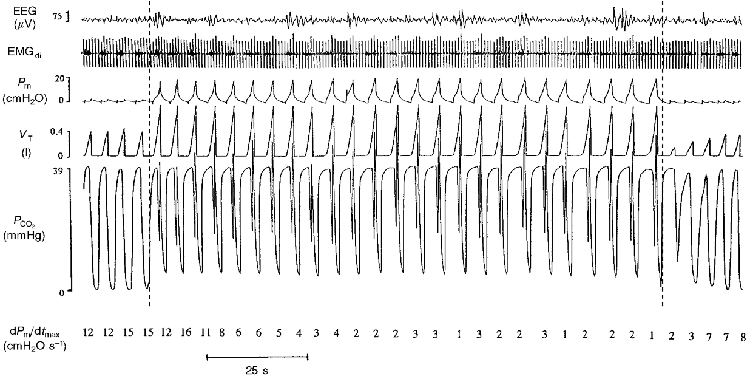
1. To determine the magnitude and time course of changes in respiratory motor output caused by non-chemical influences, six sleeping subjects underwent assist-control mechanical ventilation (ACMV) at increased tidal volume (VT). During ACMV, end-tidal PCO2 (PET,CO2) was either held at normocapnic levels (PET,CO2, 0.6-1.1 mmHg > control) by adding CO2 to the inspirate, or it was allowed to fall (hypocapnia). 2. Each sleeping subject underwent several repeat trials of twenty-five ACMV breaths (VT, 1.3 or 2.1 times control; peak flow rate, 30-40 l min-1; inspiratory time, +/- 0.3 s of control). The end-tidal to arterial PCO2 difference throughout normocapnic ACMV at raised VT was unchanged from eupnoeic levels during studies in wakefulness. 3. Normocapnic ACMV at both the smaller and larger increases in VT decreased the amplitude of respiratory motor output, as judged by decreased maximum rate of rise of mask pressure (Pm) (mean dPm/dtmax, 46-68% of control), reduced diaphragmatic EMG (to 55% of control) and reduced VT on the first spontaneous breath after ACMV (to 70% of control). Expiratory time (TE) was slightly prolonged (13-32% > control). This inhibition of amplitude of respiratory motor output progressed over the first five to seven ventilator cycles, was maintained over the remaining 18-20 cycles and persisted for three to five spontaneous breaths immediately following cessation of ACMV. 4. Hypocapnia did not further inhibit respiratory motor output amplitude beyond the effect of normocapnic ACMV at high VT, but did cause highly variable prolongation of TE when PET,CO2 was reduced by greater than 3 mmHg for at least five ventilator cycles. 5. These data in sleeping humans support the existence of a significant, non-chemical inhibitory influence of ACMV at increased VT and positive pressure upon the amplitude of respiratory motor output; this effect is manifested both during and following normocapnic mechanical ventilation.
Figures


Similar articles
-
Apnoea following normocapnic mechanical ventilation in awake mammals: a demonstration of control system inertia.J Physiol. 1993 Dec;472:749-68. doi: 10.1113/jphysiol.1993.sp019971. J Physiol. 1993. PMID: 8145170 Free PMC article.
-
Nonchemical elimination of inspiratory motor output via mechanical ventilation in sleep.Am J Respir Crit Care Med. 2001 May;163(6):1356-64. doi: 10.1164/ajrccm.163.6.2004169. Am J Respir Crit Care Med. 2001. PMID: 11371401
-
Inhibition of inspiratory muscle activity during sleep. Chemical and nonchemical influences.Am Rev Respir Dis. 1988 Jul;138(1):8-15. doi: 10.1164/ajrccm/138.1.8. Am Rev Respir Dis. 1988. PMID: 3144204
-
Effect of inspiratory time and flow settings during assist-control ventilation.Curr Opin Crit Care. 2003 Feb;9(1):39-44. doi: 10.1097/00075198-200302000-00008. Curr Opin Crit Care. 2003. PMID: 12548028 Review.
-
The validity of surface EMG of extra-diaphragmatic muscles in assessing respiratory responses during mechanical ventilation: A systematic review.Pulmonology. 2020 Nov-Dec;26(6):378-385. doi: 10.1016/j.pulmoe.2020.02.008. Epub 2020 Apr 2. Pulmonology. 2020. PMID: 32247711 Free PMC article.
Cited by
-
Characterizing and Modeling Breathing Dynamics: Flow Rate, Rhythm, Period, and Frequency.Front Physiol. 2022 Feb 21;12:772295. doi: 10.3389/fphys.2021.772295. eCollection 2021. Front Physiol. 2022. PMID: 35264974 Free PMC article.
-
Effects of stabilizing or increasing respiratory motor outputs on obstructive sleep apnea.J Appl Physiol (1985). 2013 Jul 1;115(1):22-33. doi: 10.1152/japplphysiol.00064.2013. Epub 2013 Apr 18. J Appl Physiol (1985). 2013. PMID: 23599393 Free PMC article.
-
Effect of hypoxia on the hypopnoeic and apnoeic threshold for CO(2) in sleeping humans.J Physiol. 2001 Aug 15;535(Pt 1):269-78. doi: 10.1111/j.1469-7793.2001.00269.x. J Physiol. 2001. PMID: 11507176 Free PMC article.
References
-
- Badr MS, Skatrud JB, Dempsey JA. Effect of chemoreceptor stimulation and inhibition on total pulmonary resistance in humans during NREM sleep. Journal of Applied Physiology. 1994;76:1682–1692. - PubMed
-
- Corfield D, Morrell MJ, Guz A. The nature of breathing during hypocapnia in awake man. Respiration Physiology. 1995;101:145–160. - PubMed
-
- Fink BR, Hanks EC, Ngal EH, Pappen EM. Central regulation of respiration during anesthesia and wakefulness. Annals of the New York Academy of Sciences. 1963;109:892–899.
-
- Fowler WS. Breaking point of breath-holding. Journal of Applied Physiology. 1954;6:539–545. - PubMed
Publication types
MeSH terms
Substances
Grants and funding
LinkOut - more resources
Full Text Sources
Miscellaneous