

Dynamics of phosphorothioate oligonucleotides in normal and laser photocoagulated retina
- PMID: 10381674
- PMCID: PMC1723113
- DOI: 10.1136/bjo.83.7.852
Dynamics of phosphorothioate oligonucleotides in normal and laser photocoagulated retina
Abstract
Aims: To investigate the distribution, persistence, and stability of fluorescently labelled phosphorothioate oligonucleotides (PS-ODNs) in normal and laser photocoagulated retina following intravitreal injection in the rat.
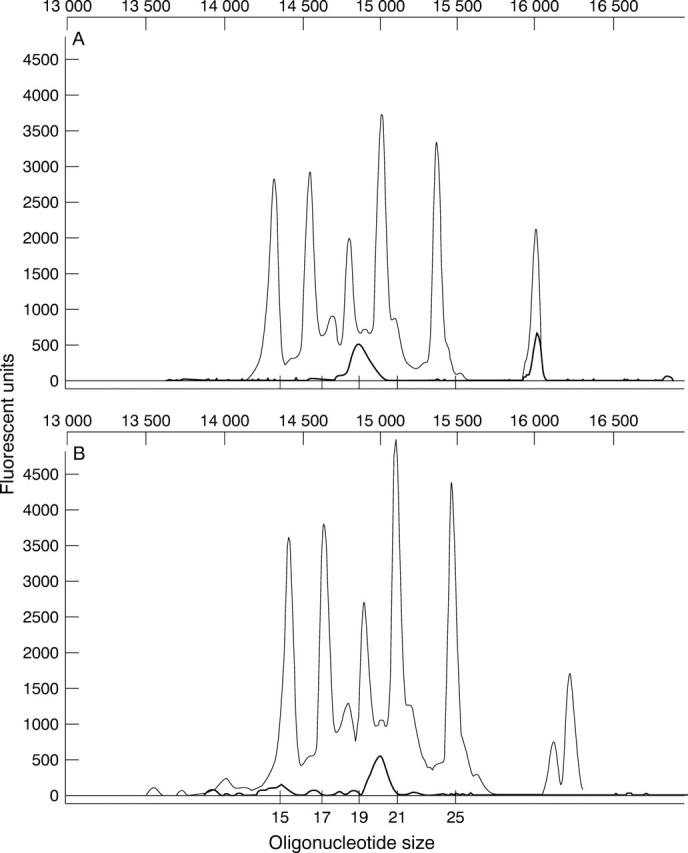
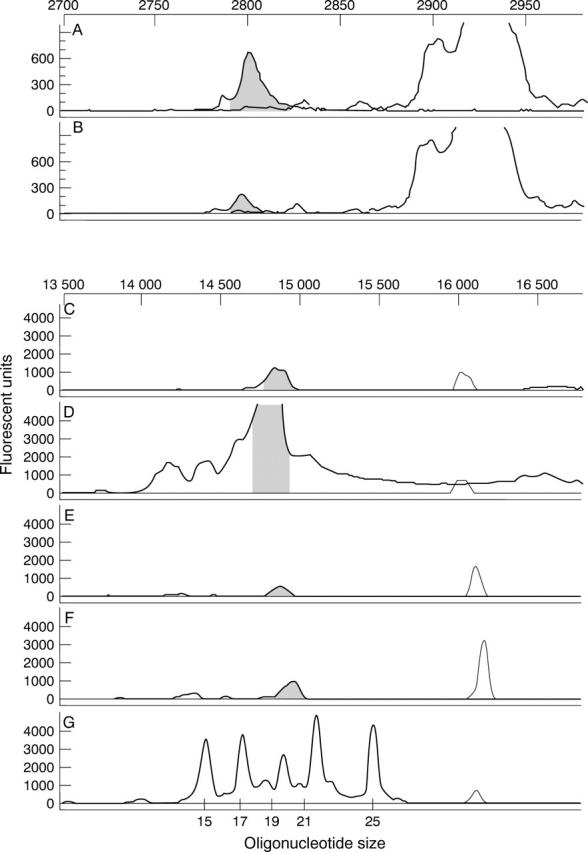
Methods: Fluorescently labelled PS-ODNs were injected intravitreally into pigmented eyes at doses of 0.5-10.0 nmol in 2.0 microl solution. The dynamics of PS-ODNs was evaluated by fluorescent microscopy of cryosections and flat mounted retinal pigment epithelium (RPE)-choroid-sclera. Genescan analysis was used to assess the integrity of PS-ODNs in the retina after injection. The dynamics of PS-ODNs was also evaluated in the retina following krypton laser photocoagulation with a protocol producing choroidal neovascularisation (CNV).
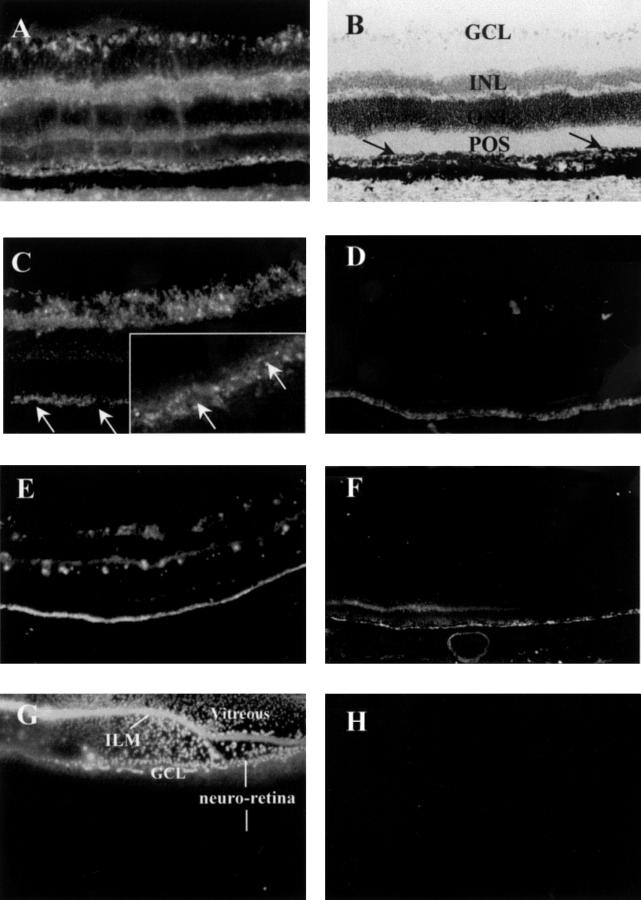
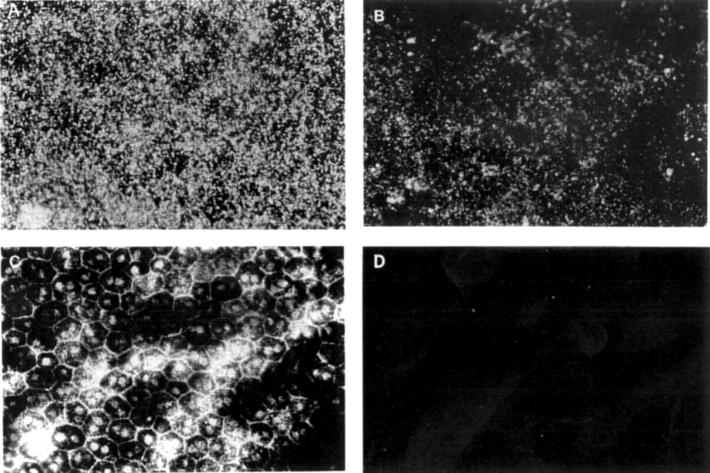
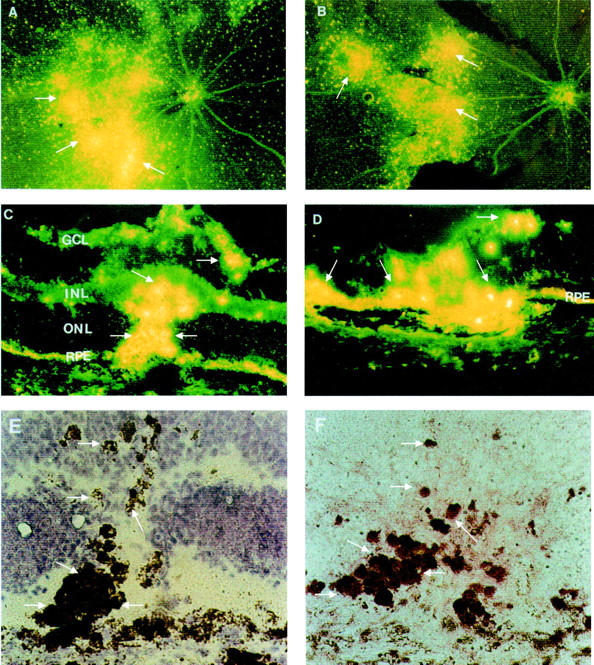
Results: Following intravitreal injection the PS-ODNs demonstrated dose and time dependent distribution and persistence in the retina, where they accessed all neural layers. However, they preferentially accumulated in the RPE layer, demonstrated as bright granules in the cytoplasm of the cells. Injections of 5.0 and 7.5 nmol of PS-ODNs exhibited strong fluorescence in the retina for 6 weeks after injection. Genescan analysis demonstrated that the PS-ODNs remained almost completely intact for at least 12 weeks. Following laser treatment, the PS-ODNs were concentrated in the regions of laser photocoagulation and retained high intensity for at least 8 weeks after injection, particularly localised to macrophages, RPE, and the local choroidal tissue.
Conclusions: These results indicate that PS-ODNs are stable and accessible to most neural layers of the retina, and they preferentially accumulate in the RPE layer following intravitreal injection. The successful delivery of PS-ODNs into normal and laser photocoagulated retina suggests that PS-ODNs may have potential in the development of therapy for attenuating retinal degenerations and CNV.
Figures
Similar articles
-
Uptake dynamics and retinal tolerance of phosphorothioate oligonucleotide and its direct delivery into the site of choroidal neovascularization through subretinal administration in the rat.Antisense Nucleic Acid Drug Dev. 2001 Aug;11(4):257-64. doi: 10.1089/108729001317022250. Antisense Nucleic Acid Drug Dev. 2001. PMID: 11572602
-
Expression of cell adhesion molecules and vascular endothelial growth factor in experimental choroidal neovascularisation in the rat.Br J Ophthalmol. 1998 Sep;82(9):1063-71. doi: 10.1136/bjo.82.9.1063. Br J Ophthalmol. 1998. PMID: 9893599 Free PMC article.
-
In vivo delivery of phosphorothioate oligonucleotides into murine retina.Arch Ophthalmol. 1998 Mar;116(3):342-8. doi: 10.1001/archopht.116.3.342. Arch Ophthalmol. 1998. PMID: 9514488
-
Growth factor staining patterns in the pig retina following retinal laser photocoagulation.Br J Ophthalmol. 1999 Jun;83(6):728-36. doi: 10.1136/bjo.83.6.728. Br J Ophthalmol. 1999. PMID: 10340985 Free PMC article.
-
[A new approach for studying the retinal and choroidal circulation].Nippon Ganka Gakkai Zasshi. 2004 Dec;108(12):836-61; discussion 862. Nippon Ganka Gakkai Zasshi. 2004. PMID: 15656089 Review. Japanese.
Cited by
-
Intravitreal Injection of Splice-switching Oligonucleotides to Manipulate Splicing in Retinal Cells.Mol Ther Nucleic Acids. 2015 Sep 1;4(9):e250. doi: 10.1038/mtna.2015.24. Mol Ther Nucleic Acids. 2015. PMID: 26325627 Free PMC article.
-
Antisense Oligonucleotide-Based Splicing Correction in Individuals with Leber Congenital Amaurosis due to Compound Heterozygosity for the c.2991+1655A>G Mutation in CEP290.Int J Mol Sci. 2018 Mar 7;19(3):753. doi: 10.3390/ijms19030753. Int J Mol Sci. 2018. PMID: 29518907 Free PMC article.
-
Lentivirus vector-mediated knockdown of erythropoietin-producing hepatocellular carcinoma receptors B4 inhibits laser-induced choroidal neovascularization.J Ocul Pharmacol Ther. 2013 Feb;29(1):14-22. doi: 10.1089/jop.2012.0077. Epub 2012 Oct 4. J Ocul Pharmacol Ther. 2013. PMID: 23035975 Free PMC article.
-
Generation of transgenic mice with mild and severe retinal neovascularisation.Br J Ophthalmol. 2005 Jul;89(7):911-6. doi: 10.1136/bjo.2004.059089. Br J Ophthalmol. 2005. PMID: 15965177 Free PMC article.
-
Nonviral ocular gene therapy: assessment and future directions.Curr Opin Mol Ther. 2008 Oct;10(5):456-63. Curr Opin Mol Ther. 2008. PMID: 18830921 Free PMC article. Review.
References
Publication types
MeSH terms
Substances
LinkOut - more resources
Full Text Sources
Other Literature Sources