

Somatic pairing of homologs in budding yeast: existence and modulation
- PMID: 10385630
- PMCID: PMC316803
- DOI: 10.1101/gad.13.12.1627
Somatic pairing of homologs in budding yeast: existence and modulation
Abstract
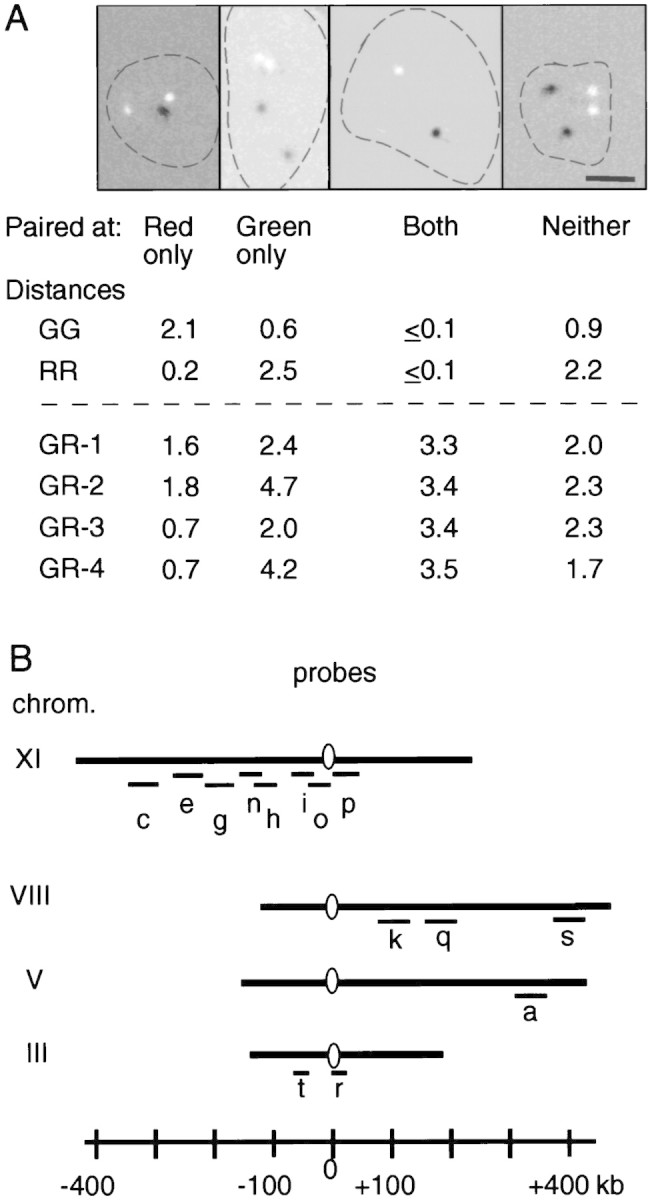
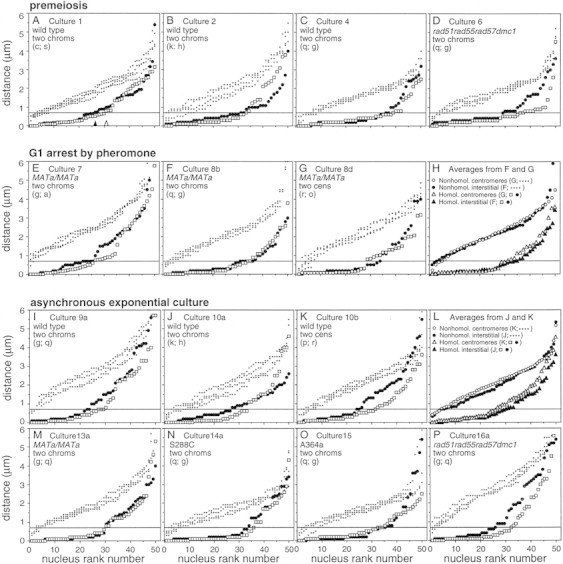
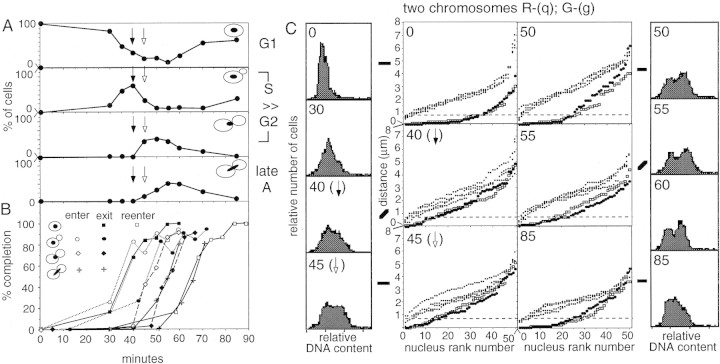
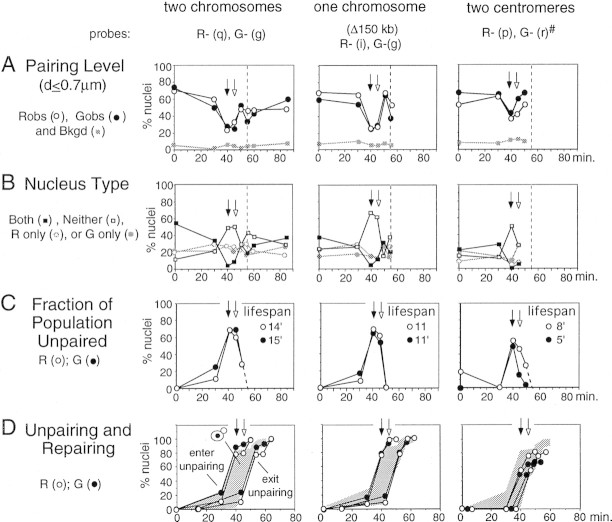
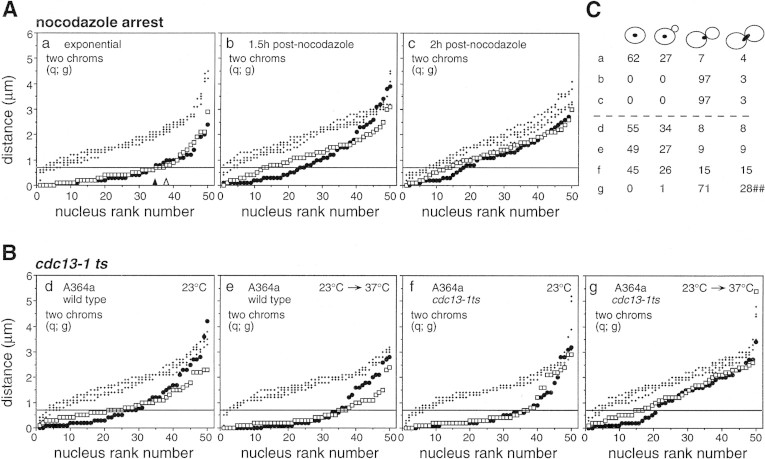
FISH analysis of well-spread chromosomes reveals that homologs are paired in vegetatively growing budding yeast diploid cells, via multiple interstitial interactions, and independent of recA homologs and mating type heterozygosity. Pairing is present during G1 and G2, and in cells arrested at G1 by mating pheromone, but is disrupted during S phase. Thus, somatic pairing is qualitatively analogous to premeiotic and early meiotic pairing. S-phase pairing disruption occurs by a complex intranuclear program involving regional, nucleus-wide, and temporal determinants. Pairing is also disrupted in two G2-arrest conditions (cdc13ts and nocodazole). Together these findings suggest that cell cycle signals may provoke pairing disruption by modulating underlying chromosome and/or chromatin structure. Whether the cell chooses to disrupt pairing contacts or not (e.g., S phase and G2 arrest, but not G1 arrest or normal G1 or G2), could be dictated by functional considerations involving homolog/sister discrimination.
Figures
Similar articles
-
Chromosome pairing via multiple interstitial interactions before and during meiosis in yeast.Cell. 1994 Jul 1;77(7):977-91. doi: 10.1016/0092-8674(94)90438-3. Cell. 1994. PMID: 8020104
-
G1 cyclins block the Ime1 pathway to make mitosis and meiosis incompatible in budding yeast.EMBO J. 1999 Jan 15;18(2):320-9. doi: 10.1093/emboj/18.2.320. EMBO J. 1999. PMID: 9889189 Free PMC article.
-
Chromosome condensation and sister chromatid pairing in budding yeast.J Cell Biol. 1994 May;125(3):517-30. doi: 10.1083/jcb.125.3.517. J Cell Biol. 1994. PMID: 8175878 Free PMC article.
-
Homologous pairing and chromosome dynamics in meiosis and mitosis.Biochim Biophys Acta. 2004 Mar 15;1677(1-3):165-80. doi: 10.1016/j.bbaexp.2003.11.017. Biochim Biophys Acta. 2004. PMID: 15020057 Review.
-
Premeiotic events and meiotic chromosome pairing.Symp Soc Exp Biol. 1984;38:87-121. Symp Soc Exp Biol. 1984. PMID: 6400221 Review.
Cited by
-
Recombination-independent recognition of DNA homology for repeat-induced point mutation.Curr Genet. 2017 Jun;63(3):389-400. doi: 10.1007/s00294-016-0649-4. Epub 2016 Sep 14. Curr Genet. 2017. PMID: 27628707 Free PMC article. Review.
-
Measurement of spatial proximity and accessibility of chromosomal loci in Saccharomyces cerevisiae using Cre/loxP site-specific recombination.Methods Mol Biol. 2009;557:55-63. doi: 10.1007/978-1-59745-527-5_5. Methods Mol Biol. 2009. PMID: 19799176 Free PMC article. Review.
-
Interallelic interaction and gene regulation in budding yeast.Proc Natl Acad Sci U S A. 2016 Apr 19;113(16):4428-33. doi: 10.1073/pnas.1601003113. Epub 2016 Apr 4. Proc Natl Acad Sci U S A. 2016. PMID: 27044105 Free PMC article.
-
Multiple opposing constraints govern chromosome interactions during meiosis.PLoS Genet. 2013;9(1):e1003197. doi: 10.1371/journal.pgen.1003197. Epub 2013 Jan 17. PLoS Genet. 2013. PMID: 23341780 Free PMC article.
-
Chromosome pairing does not contribute to nuclear architecture in vegetative yeast cells.Eukaryot Cell. 2003 Oct;2(5):856-66. doi: 10.1128/EC.2.5.856-866.2003. Eukaryot Cell. 2003. PMID: 14555468 Free PMC article.
References
-
- Alani E, Padmore R, Kleckner N. Analysis of wild-type and rad50mutants of yeast suggests an intimate relationship between meiotic chromosome synapsis and recombination. Cell. 1990;61:419–436. - PubMed
-
- Aramayo R, Metzenberg RL. Meiotic transvection in fungi. Cell. 1996;86:103–113. - PubMed
-
- Arnoldus EP, Peters AC, Bots GT, Raap AK, van der Ploeg M. Somatic pairing of chromosome 1 centromeres in interphase nuclei of human cerebellum. Hum Genet. 1989;83:231–234. - PubMed
-
- Bender J. Cytosine methylation of repeated sequences in eukaryotes: The role of DNA pairing. Trends Biochem Sci. 1998;23:252–256. - PubMed
Publication types
MeSH terms
Substances
Grants and funding
LinkOut - more resources
Full Text Sources
Molecular Biology Databases