. 1999 Jul;65(7):2877-94.
doi: 10.1128/AEM.65.7.2877-2894.1999.

Cell surface analysis techniques: What do cell preparation protocols do to cell surface properties?

Affiliations

Cell surface analysis techniques: What do cell preparation protocols do to cell surface properties?

R S Pembrey et al. Appl Environ Microbiol. 1999 Jul.

Abstract

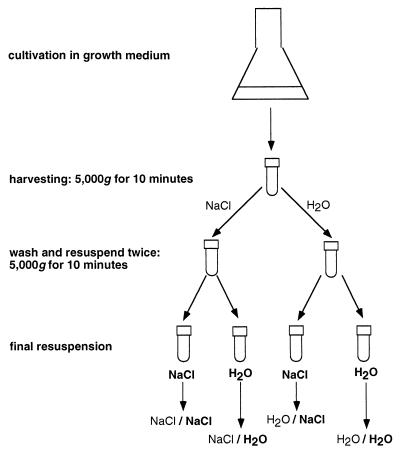
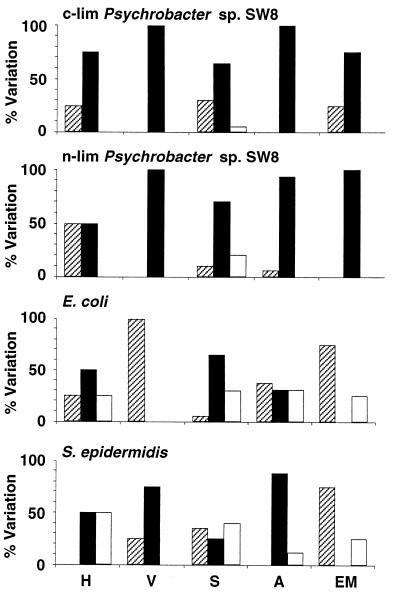
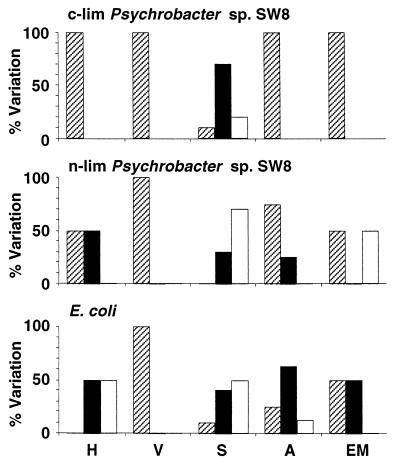
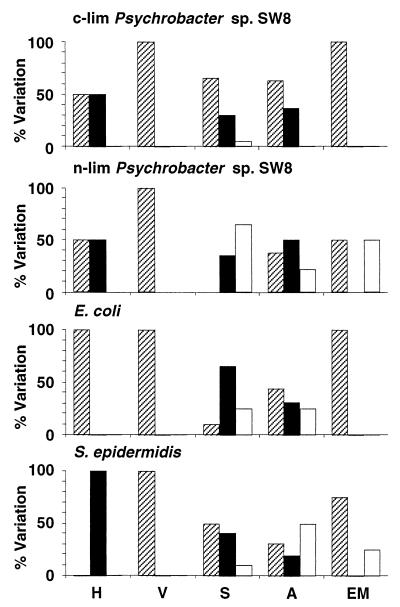
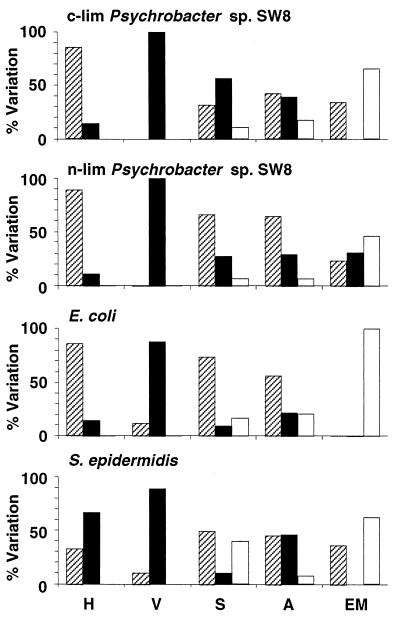
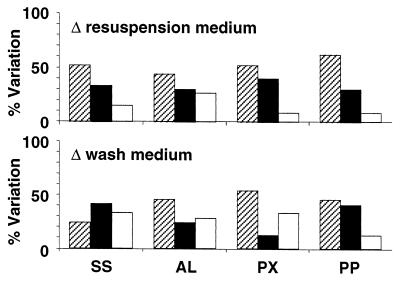
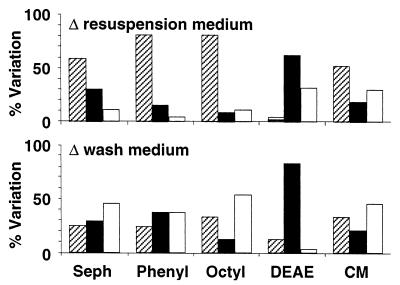
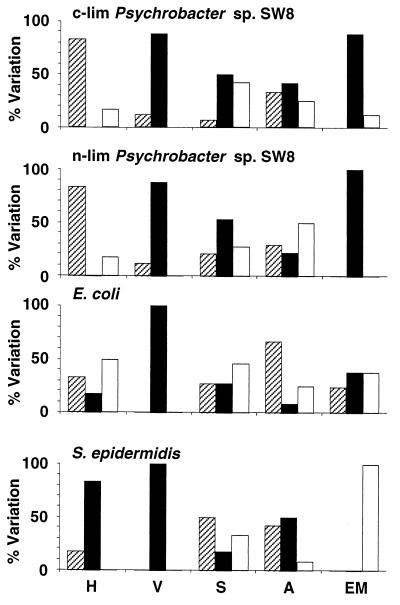
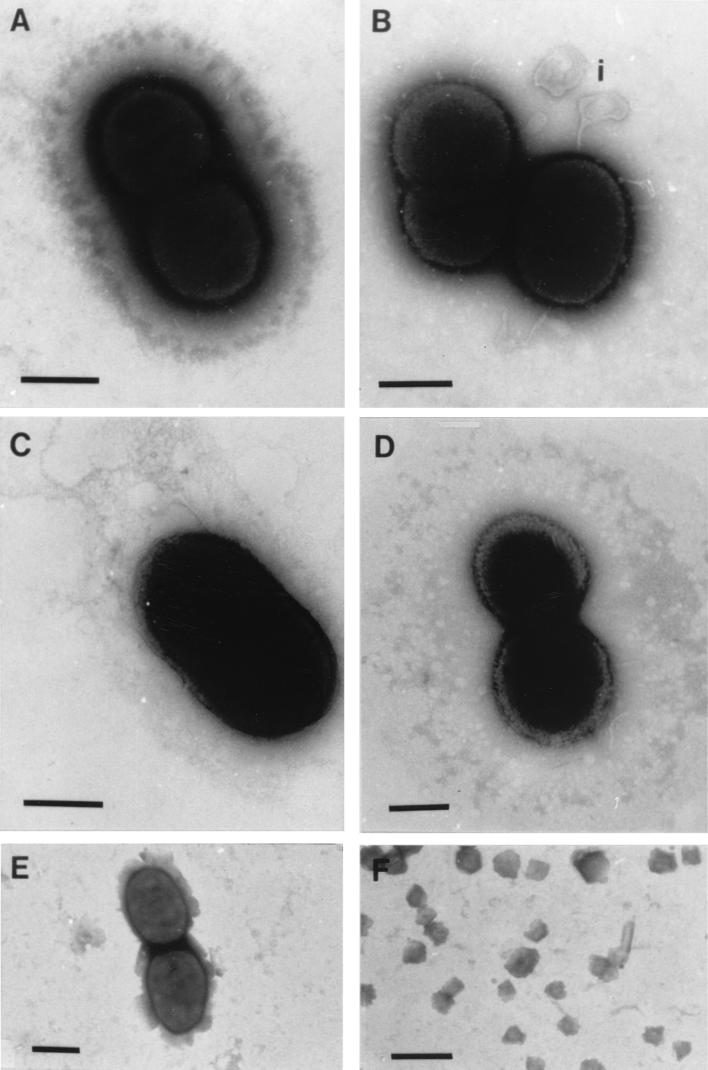
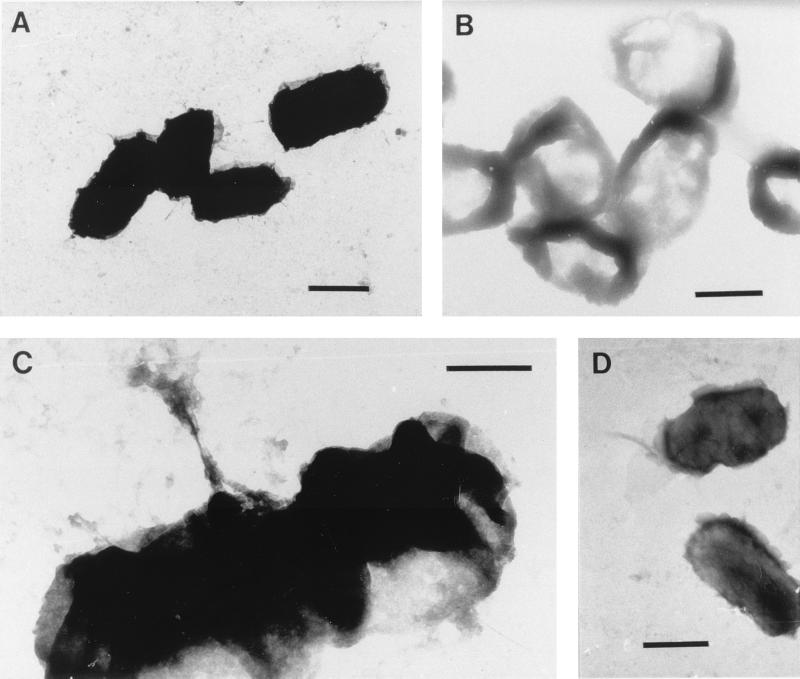
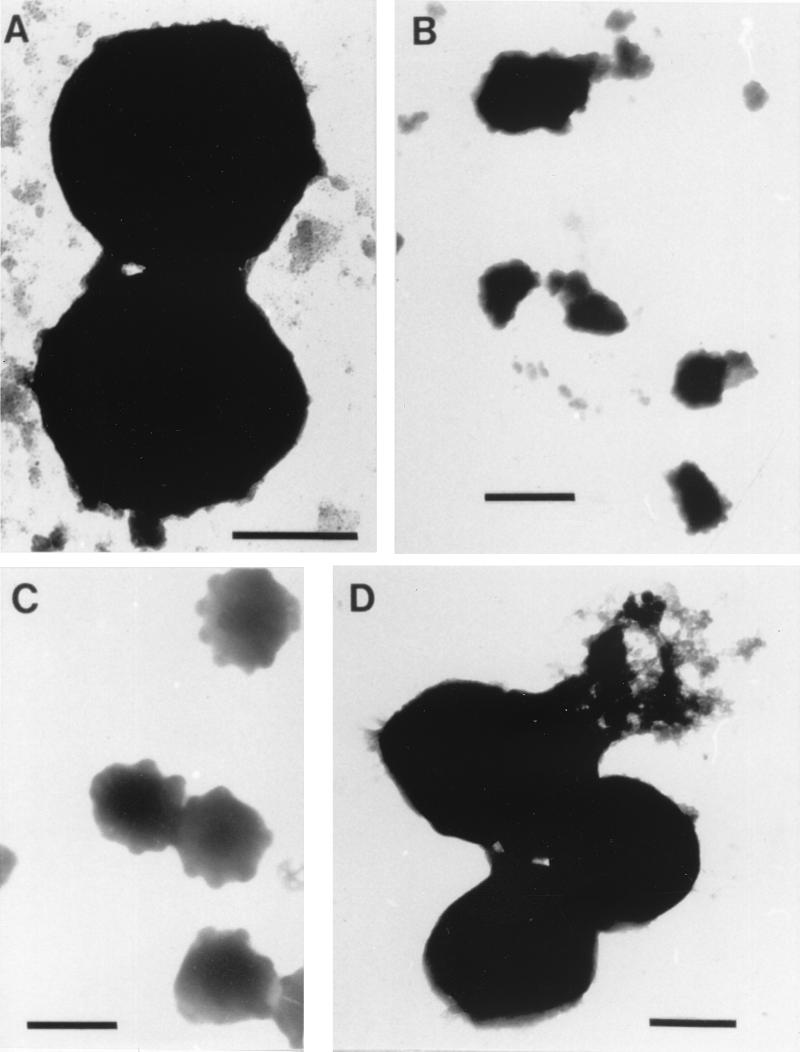
Cell surface analysis often requires manipulation of cells prior to examination. The most commonly employed procedures are centrifugation at different speeds, changes of media during washing or final resuspension, desiccation (either air drying for contact angle measurements or freeze-drying for sensitive spectroscopic analysis, such as X-ray photoelectron spectroscopy), and contact with hydrocarbon (hydrophobicity assays). The effects of these procedures on electrophoretic mobility, adhesion to solid substrata, affinity to a number of Sepharose columns, structural integrity, and cell viability were systematically investigated for a range of model organisms, including carbon- and nitrogen-limited Psychrobacter sp. strain SW8 (glycocalyx-bearing cells), Escherichia coli (gram-negative cells without a glycocalyx), and Staphylococcus epidermidis (gram-positive cells without a glycocalyx). All of the cell manipulation procedures severely modified the physicochemical properties of cells, but with each procedure some organisms were more susceptible than others. Considerable disruption of cell surfaces occurred when organisms were placed in contact with a hydrocarbon (hexadecane). The majority of cells became nonculturable after air drying and freeze-drying. Centrifugation at a high speed (15,000 x g) modified many cell surface parameters significantly, although cell viability was considerably affected only in E. coli. The type of washing or resuspension medium had a strong influence on the values of cell surface parameters, particularly when high-salt solutions were compared with low-salt buffers. The values for parameters obtained with different methods that allegedly measure similar cell surface properties did not correlate for most cells. These results demonstrate that the methods used to prepare cells for cell surface analysis need to be critically investigated for each microorganism so that the final results obtained reflect the nature of the in situ microbial cell surface as closely as possible. There is an urgent need for new, reliable, nondestructive, minimally manipulative cell surface analysis techniques that can be used in situ.


Figures

FIG. 1
FIG. 1
Schematic representation of the harvesting protocol and washing sequences used to prepare microorganisms for cell surface analysis. In each case the washing medium is listed before the resuspension medium (i.e., wash medium/resuspension medium).
FIG. 2
FIG. 2
Effects of centrifugation at 15,000 × g on microbial physicochemical cell surface properties. H, hydrophobicity; V, viability; S, Sepharose column assays; A, attachment to solid substrata; EM, electrophoretic mobility. The percentages of experiments where the values of the parameters after treatment were reduced (cross-hatched bars), unchanged (solid bars), and increased (open bars) are shown. For information on reference data and modifications of the parameters see Tables 1 through 8. c-lim, carbon limited; n-lim, nitrogen limited.
FIG. 3
FIG. 3
Effects of freeze-drying on microbial physicochemical cell surface properties. H, hydrophobicity; V, viability; S, Sepharose column assays; A, attachment to solid substrata; EM, electrophoretic mobility. The percentages of experiments where the values of the parameters after treatment were reduced (cross-hatched bars), unchanged (solid bars), and increased (open bars) are shown. For information on reference data and modifications of the parameters see Tables 1 through 8. c-lim, carbon limited; n-lim, nitrogen limited.
FIG. 4
FIG. 4
Effects of air drying on microbial physicochemical cell surface properties. H, hydrophobicity; V, viability; S, Sepharose column assays; A, attachment to solid substrata; EM, electrophoretic mobility. The percentages of experiments where the values of the parameters after treatment were reduced (cross-hatched bars), unchanged (solid bars), and increased (open bars) are shown. For information on reference data and modifications of the parameters see Tables 1 through 8. c-lim, carbon limited; n-lim, nitrogen limited.
FIG. 5
FIG. 5
Effects of changes in resuspension medium on microbial physicochemical cell surface properties. H, hydrophobicity; V, viability; S, Sepharose column assays; A, attachment to solid substrata; EM, electrophoretic mobility. The percentages of experiments where the values of the parameters after treatment were reduced (cross-hatched bars), unchanged (solid bars), and increased (open bars) are shown. For information on reference data and modifications of the parameters see Tables 1 through 8. c-lim, carbon limited; n-lim, nitrogen limited.
FIG. 6
FIG. 6
Effects of changes of the resuspension and washing media on attachment of cells to substrata. SS, stainless steel; AL, aluminum; PX, perspex, PP, polypropylene. The percentages of experiments where the values of the parameters after treatment were reduced (cross-hatched bars), unchanged (solid bars), and increased (open bars) are shown. For information on reference data and modifications of the parameters see Tables 1 through 8.
FIG. 7
FIG. 7
Effects of changes of the resuspension and washing media on the retention of cells in Sepharose columns. Seph, unsubstituted Sepharose; Phenyl, phenyl-Sepharose; Octyl, octyl-Sepharose; DEAE, DEAE-Sepharose; CM, carboxymethyl-Sepharose. The percentages of experiments where the values of the parameters after treatment were reduced (cross-hatched bars), unchanged (solid bars), and increased (open bars) are shown. For information on reference data and modifications of the parameters see Tables 1 through 8.
FIG. 8
FIG. 8
Effects of changes of washing medium on microbial physicochemical cell surface properties. H, hydrophobicity; V, viability; S, Sepharose column assays; A, attachment to solid substrata; EM, electrophoretic mobility. The percentages of experiments where the values of the parameters after treatment were reduced (cross-hatched bars), unchanged (solid bars), and increased (open bars) are shown. For information on reference data and modifications of the parameters see Tables 1 through 8. c-lim, carbon limited; n-lim, nitrogen limited.
FIG. 9
FIG. 9
Negatively stained electron micrographs of Psychrobacter sp. strain SW8. (A) Cells harvested by centrifugation at 5,000 × g. Bar = 1 μm. (B) Carbon-limited phenotype harvested by centrifugation at 15,000 × g. Bar = 1 μm. i, blebbing of cell envelope. (C) Cells air dried on cellulose acetate filters. Bar = 2 μm. (D) Cells after mixing with dodecane in the MATH assay. Bar = 1 μm. (E and F) Freeze-dried cells. Bars = 2 and 5 μm, respectively.
FIG. 10
FIG. 10
Negatively stained electron micrographs of E. coli ATCC 8739. (A) Cells harvested by centrifugation at 5,000 × g. Bar = 2 μm. (B) Freeze-dried cells. Bar = 2 μm. (C and D) Cells after mixing with dodecane in the MATH assay. Bars = 1 and 2 μm, respectively.
FIG. 11
FIG. 11
Negatively stained electron micrographs of S. epidermidis NCTC 11047. (A) Cells harvested by centrifugation at 5,000 × g. Bar = 1 μm. (B) Freeze-dried cells. Bar = 2 μm. (C) Cells air dried on cellulose acetate filters. Bar = 2 μm. (D) Cells after mixing with dodecane in the MATH assay. Bar = 1 μm.

References

    1. Absolom D R, Lamberti F V, Policova Z, Zingg W, van Oss C J, Neumann A W. Surface thermodynamics of bacterial adhesion. Appl Environ Microbiol. 1983;46:90–97. - PMC - PubMed
    1. Amory D E, Mozes N, Hermesse M P, Leonard A J, Rouxhet P G. Chemical analysis of the surface of microorganisms by X-ray photoelectron spectroscopy. FEMS Microbiol Lett. 1988;49:107–110. - PubMed
    1. Beech I B, Cheung C W S, Johnson D B, Smith J R. Comparative studies of bacterial biofilms on steel surfaces using atomic force microscopy and environmental scanning electron microscopy. Biofouling. 1996;10:65–77. - PubMed
    1. Bunt C R, Jones D S, Tucker I G. The effects of pH, ionic strength and organic phase on the bacterial adhesion to hydrocarbons (BATH) test. Int J Pharm (Amsterdam) 1993;9:93–98.
    1. Busscher H J, Weerkamp A H, van der Mei H C, van Pelt A W J, DeJong H P, Arends J. Measurement of the surface free energy of bacterial cell surfaces and its relevance for adhesion. Appl Environ Microbiol. 1984;48:980–983. - PMC - PubMed

Publication types

MeSH terms

LinkOut - more resources