

Use of real-time PCR and fluorimetry to detect lamivudine resistance-associated mutations in hepatitis B virus
- PMID: 10390210
- PMCID: PMC89331
- DOI: 10.1128/AAC.43.7.1600
Use of real-time PCR and fluorimetry to detect lamivudine resistance-associated mutations in hepatitis B virus
Abstract
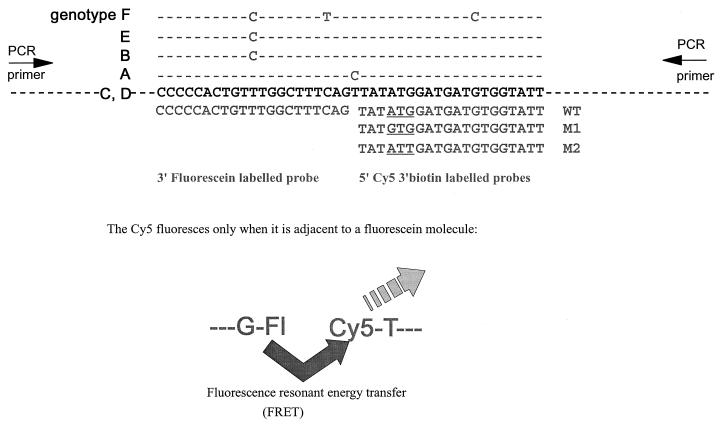
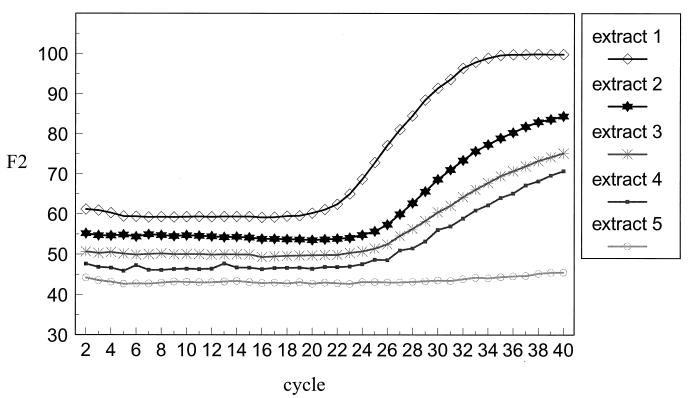
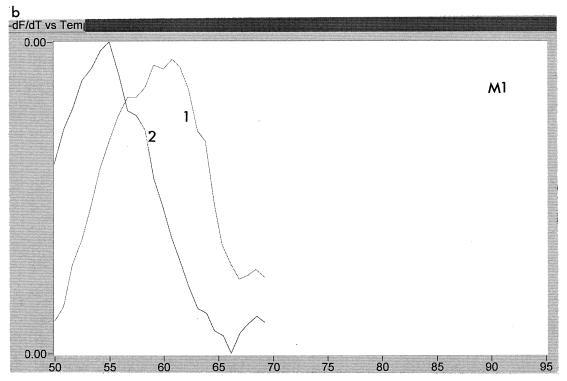
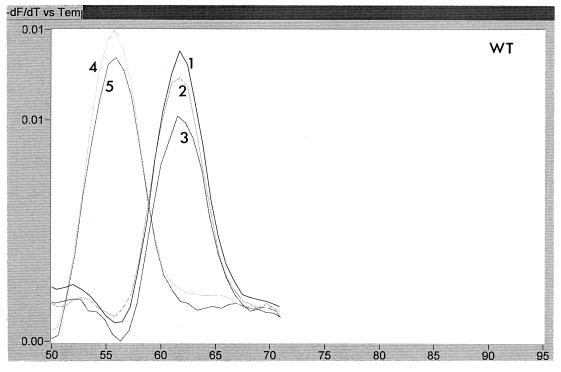
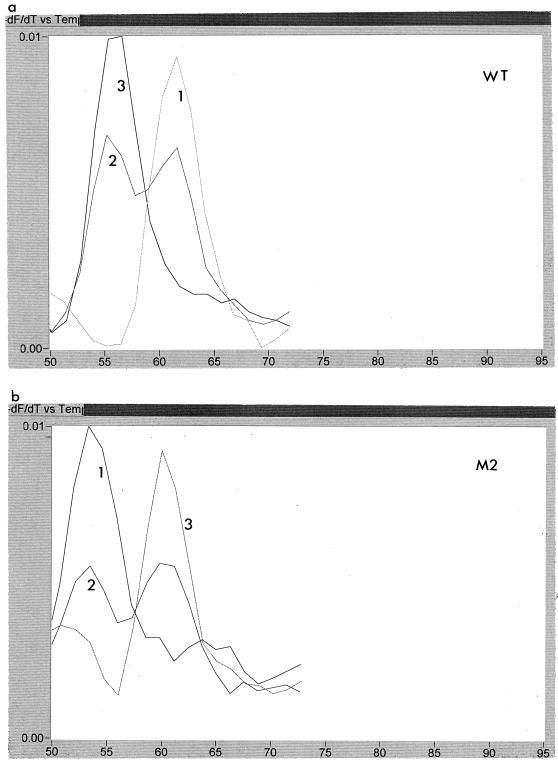
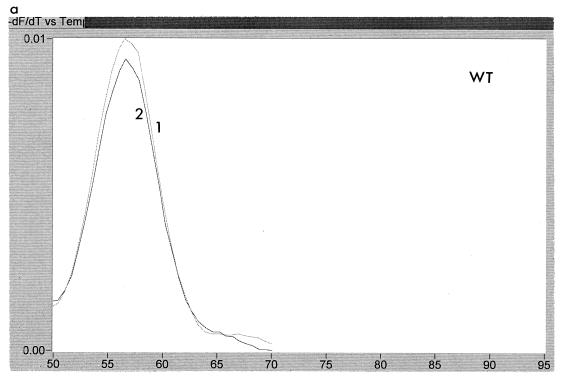
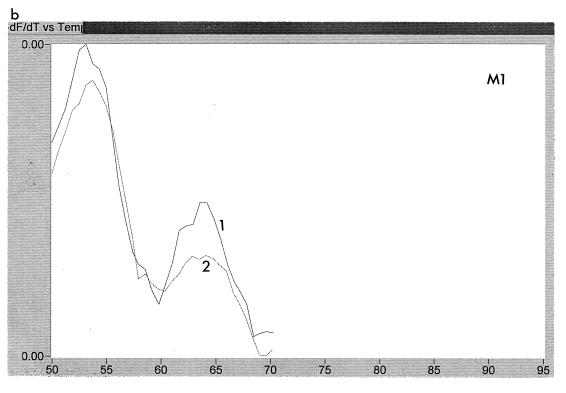
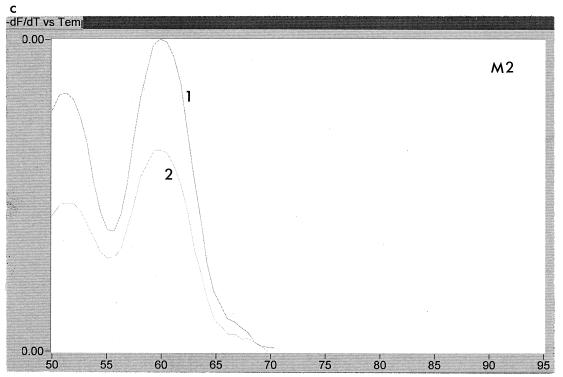
Very rapid amplification of DNA by PCR in small volumes can be continuously monitored by the detection of the binding of probes with a rapid cycler with built-in fluorometric detection. Primers were designed to amplify approximately 100 bp of the polymerase gene of hepatitis B virus (HBV) spanning codon 550, where mutations associated with resistance to lamivudine invariably occur. Four hybridization probes were synthesized: one was 3' labelled with fluorescein and hybridized upstream of codon 550. The others were 5' labelled with Cy5 and 3' labelled with biotin and spanned codon 550. The Cy5-labelled oligonucleotides contained either wild-type (ATG) or mutant (GTG or ATT) sequences. A Cy5-labelled probe and either the fluorescein-labelled probe or Sybr Green 1 (a compound that fluoresces when bound to double-stranded DNA) were included in each PCR. After completion of the amplification by using a LightCycler (Idaho Technology), the temperature at which the Cy5 probe melted from the product was determined in a melt program that took ca. 3 min. Pre- and posttreatment samples from eight patients (five chronic and three transplant) who failed lamivudine treatment were amplified, and the presence of mutations in codon 550 was determined by ABI sequencing and by using the LightCycler; in some cases PCR products were also cloned, and multiple clones were sequenced. Concordant results were obtained in all cases. We found the LightCycler to be better at resolving the sequences of genomic mixtures; for example, two samples showed a sequence at codon 550 of (A/G)T(G/T), which was found by fluorimetry to be mixtures of GTG and ATT but no ATG, and this finding was confirmed by the sequencing of clones. However, this approach was not more sensitive than population sequencing for the detection of the presence of mixtures. Overall, this pilot study has demonstrated an approach that could be an extremely rapid and economical method for the detection of lamivudine resistance-associated mutations in HBV.
Figures


Similar articles
-
Quantitation of hepatitis B lamivudine resistant mutants by real-time amplification refractory mutation system PCR.J Hepatol. 2004 Jun;40(6):986-92. doi: 10.1016/j.jhep.2004.02.009. J Hepatol. 2004. PMID: 15158340
-
Use of real-time PCR and fluorimetry for rapid detection of rifampin and isoniazid resistance-associated mutations in Mycobacterium tuberculosis.J Clin Microbiol. 2000 Sep;38(9):3194-9. doi: 10.1128/JCM.38.9.3194-3199.2000. J Clin Microbiol. 2000. PMID: 10970356 Free PMC article.
-
Rapid detection of lamivudine-resistant hepatitis B virus polymerase gene variants.J Virol Methods. 1999 Dec;83(1-2):181-7. doi: 10.1016/s0166-0934(99)00125-1. J Virol Methods. 1999. PMID: 10598095
-
[Detection of lamivudine-resistant hepatitis B virus].Nihon Rinsho. 2004 Aug;62 Suppl 8:175-9. Nihon Rinsho. 2004. PMID: 15453310 Review. Japanese. No abstract available.
-
The virological and clinical significance of mutations in the overlapping envelope and polymerase genes of hepatitis B virus.J Clin Virol. 2002 Aug;25(2):97-106. doi: 10.1016/s1386-6532(02)00049-5. J Clin Virol. 2002. PMID: 12367644 Review.
Cited by
-
Detection of Legionella pneumophila using a real-time PCR hybridization assay.J Clin Microbiol. 2000 Nov;38(11):4215-8. doi: 10.1128/JCM.38.11.4215-4218.2000. J Clin Microbiol. 2000. PMID: 11060093 Free PMC article.
-
Rapid and specific detection of Mycobacterium tuberculosis from acid-fast bacillus smear-positive respiratory specimens and BacT/ALERT MP culture bottles by using fluorogenic probes and real-time PCR.J Clin Microbiol. 2002 Nov;40(11):4143-7. doi: 10.1128/JCM.40.11.4143-4147.2002. J Clin Microbiol. 2002. PMID: 12409388 Free PMC article.
-
Detection of YMDD mutants using universal template real-time PCR.World J Gastroenterol. 2006 Feb 28;12(8):1308-11. doi: 10.3748/wjg.v12.i8.1308. World J Gastroenterol. 2006. PMID: 16534892 Free PMC article.
-
Quantitative detection of hepatitis C virus RNA by light cycler PCR and comparison with two different PCR assays.J Clin Microbiol. 2001 Feb;39(2):765-8. doi: 10.1128/JCM.39.2.765-768.2001. J Clin Microbiol. 2001. PMID: 11158147 Free PMC article.
-
Detection of mixed populations of wild-type and YMDD hepatitis B variants by pyrosequencing in acutely and chronically infected patients.BMC Microbiol. 2012 Jun 6;12:96. doi: 10.1186/1471-2180-12-96. BMC Microbiol. 2012. PMID: 22672436 Free PMC article.
References
-
- Allen M I, Deslauriers M, Andrews C W, Tipples G A, Walters K A, Tyrrell D L J, Brown N, Condreay L D. Identification and characterization of mutations in hepatitis B virus resistant to lamivudine. Hepatology. 1998;27:1670–1677. - PubMed
-
- Aye T T, Bartholomeusz A, Shaw T, Bowden S, Breschkin A, McMillan J, Angus P, Locarnini S. Hepatitis B virus polymerase mutations during antiviral therapy in a patient following liver transplantation. J Hepatol. 1997;26:1148–1153. - PubMed
-
- Bartholomew M M, Jansen R W, Jeffers L J, Reddy K R, Johnson L C, Bunzendahl H, Condreay L D, Tzakis A G, Schiff E R, Brown N A. Hepatitis-B virus resistance to lamivudine given for recurrent infection after orthotopic liver transplantation. Lancet. 1997;349:20–22. - PubMed
-
- Burroughs N J, Rand D A, Pillay D, Elias E, Mutimer D. The consequences of quasispecies heterogeneity and within-host ecology for antiviral therapy of hepatitis B virus. In: Schinazi R F, Sommadossi J P, Thomas H, editors. Therapies for viral hepatitis. International Medical Press; 1998. pp. 335–343.
-
- Buti M, Jardi R, Cotrina M, Rodriguez-Frias F, Esteban R, Guardia J. Transient emergence of hepatitis B variants in a patient with chronic hepatitis B resistant to lamivudine. J Hepatol. 1998;28:510–513. - PubMed
MeSH terms
Substances
LinkOut - more resources
Full Text Sources
Other Literature Sources
Medical
