

Kinase interaction domain of kinase-associated protein phosphatase, a phosphoprotein-binding domain
- PMID: 10393905
- PMCID: PMC22145
- DOI: 10.1073/pnas.96.14.7821
Kinase interaction domain of kinase-associated protein phosphatase, a phosphoprotein-binding domain
Abstract
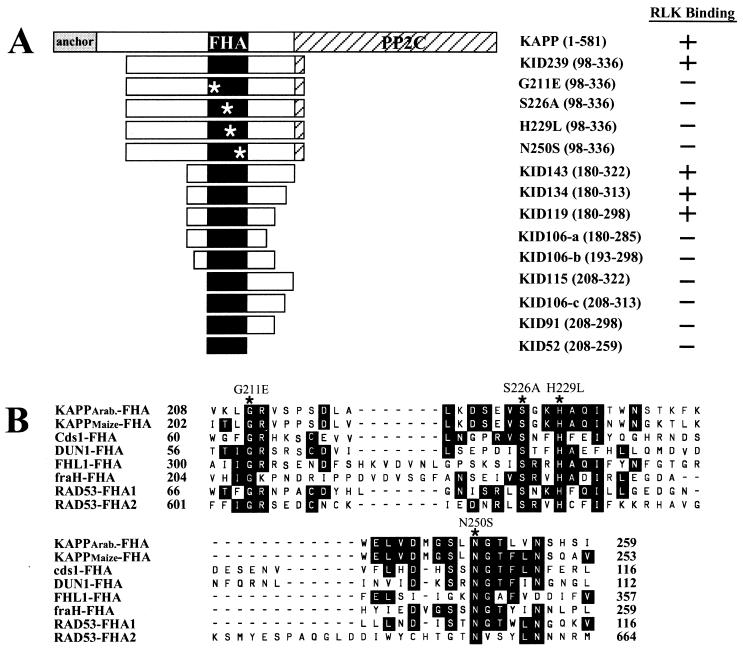
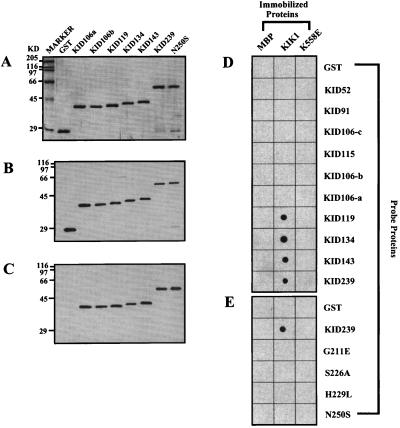
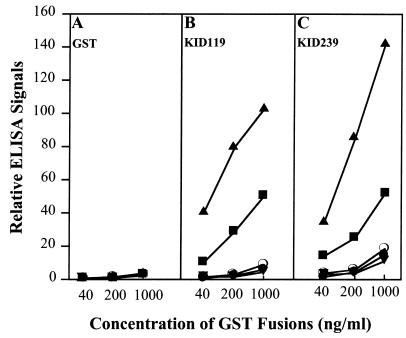
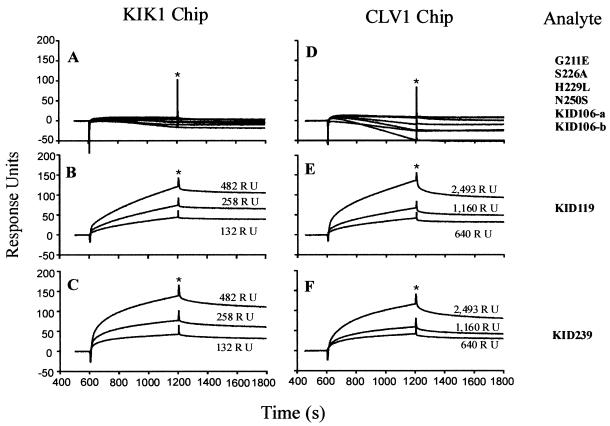
Kinase-associated protein phosphatase interacts specifically with plant receptor-like protein kinases. This interaction is thought to be a key step in signal perception and transduction. The minimal kinase interaction (KI) domain of kinase-associated protein phosphatase was mapped to a 119-aa segment spanning residues 180 to 298. A forkhead-associated (FHA) homology region resides in this minimal KI domain. Site-directed mutagenesis of four highly conserved sites in this FHA homology region abolishes the KI domain's interaction with receptor-like protein kinases, indicating that the FHA region is essential for binding. Serial deletion analysis indicates that 30 aa on each side of the FHA region are also needed for binding; this minimal functional unit is designated as the KI domain. Kinetic studies using surface plasmon resonance indicate that the binding between the KI domain and receptor-like protein kinases has a dissociation constant (KD) of about 25-100 nM, which is similar to the binding affinity of two other well characterized phosphorylation-dependent protein-binding domains (14-3-3 and Src homology 2) and their high-affinity phosphopeptide ligands.
Figures
Similar articles
-
Phosphoprotein and phosphopeptide interactions with the FHA domain from Arabidopsis kinase-associated protein phosphatase.Biochemistry. 2007 Mar 13;46(10):2684-96. doi: 10.1021/bi061763n. Epub 2007 Feb 16. Biochemistry. 2007. PMID: 17302430
-
NMR structure of the forkhead-associated domain from the Arabidopsis receptor kinase-associated protein phosphatase.Proc Natl Acad Sci U S A. 2003 Sep 30;100(20):11261-6. doi: 10.1073/pnas.2031918100. Epub 2003 Sep 18. Proc Natl Acad Sci U S A. 2003. PMID: 14500786 Free PMC article.
-
PhosphoThr peptide binding globally rigidifies much of the FHA domain from Arabidopsis receptor kinase-associated protein phosphatase.Biochemistry. 2005 Aug 2;44(30):10119-34. doi: 10.1021/bi050414a. Biochemistry. 2005. PMID: 16042389 Free PMC article.
-
The FHA domain mediates phosphoprotein interactions.J Cell Sci. 2000 Dec;113 Pt 23:4143-9. doi: 10.1242/jcs.113.23.4143. J Cell Sci. 2000. PMID: 11069759 Review.
-
Mechanistic insights into phosphoprotein-binding FHA domains.Acc Chem Res. 2008 Aug;41(8):991-9. doi: 10.1021/ar700148u. Epub 2008 Jul 26. Acc Chem Res. 2008. PMID: 18656966 Free PMC article. Review.
Cited by
-
The Arabidopsis kinase-associated protein phosphatase KAPP, interacting with protein kinases SnRK2.2/2.3/2.6, negatively regulates abscisic acid signaling.Plant Mol Biol. 2020 Jan;102(1-2):199-212. doi: 10.1007/s11103-019-00941-8. Epub 2019 Dec 7. Plant Mol Biol. 2020. PMID: 31813113
-
A novel domain in the protein kinase SOS2 mediates interaction with the protein phosphatase 2C ABI2.Proc Natl Acad Sci U S A. 2003 Sep 30;100(20):11771-6. doi: 10.1073/pnas.2034853100. Epub 2003 Sep 22. Proc Natl Acad Sci U S A. 2003. PMID: 14504388 Free PMC article.
-
Hint, Fhit, and GalT: function, structure, evolution, and mechanism of three branches of the histidine triad superfamily of nucleotide hydrolases and transferases.Biochemistry. 2002 Jul 23;41(29):9003-14. doi: 10.1021/bi025942q. Biochemistry. 2002. PMID: 12119013 Free PMC article.
-
Isolation and developmental expression of Xenopus FoxJ1 and FoxK1.Dev Genes Evol. 2004 Apr;214(4):200-5. doi: 10.1007/s00427-004-0391-7. Epub 2004 Feb 18. Dev Genes Evol. 2004. PMID: 14986136
-
Interaction of calmodulin, a sorting nexin and kinase-associated protein phosphatase with the Brassica oleracea S locus receptor kinase.Plant Physiol. 2003 Oct;133(2):919-29. doi: 10.1104/pp.103.023846. Plant Physiol. 2003. PMID: 14555783 Free PMC article.
References
Publication types
MeSH terms
Substances
LinkOut - more resources
Full Text Sources
Other Literature Sources
Molecular Biology Databases
Miscellaneous
