

Review
doi: 10.1136/bjo.83.2.241.
Birdshot retinochoroidopathy
Affiliations
- PMID: 10396206
- PMCID: PMC1722935
- DOI: 10.1136/bjo.83.2.241
Item in Clipboard
Review
Birdshot retinochoroidopathy
Br J Ophthalmol.
1999 Feb.
No abstract available
Figures
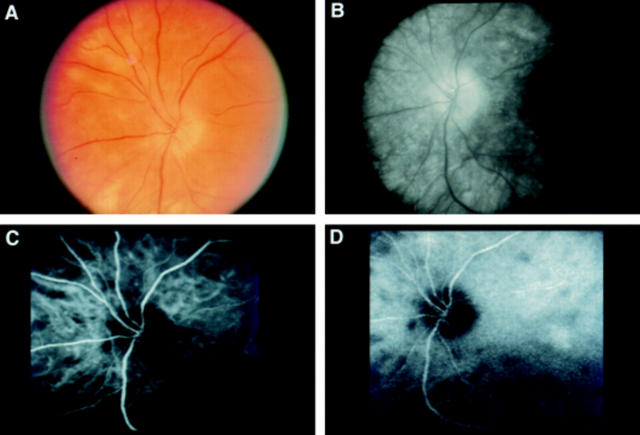
(A) Photograph of the left peripapillary fundus of a patient with short standing birdshot retinochoroidopathy, showing relatively few birdshot lesions and optic disc oedema. (B) Late phase of fluorescein angiography of the same eye, demonstrating silence of birdshot lesions. Optic disc leakage also is evident. (C) and (D) Early and late phases respectively of indocyanine green angiography of the same eye, revealing more birdshot lesions than ophthalmoscopy or fluorescein angiography. The lesions manifest early in the study and persist essentially unchanged. There is no sign of the optic disc oedema evident with fluorescein angiography.
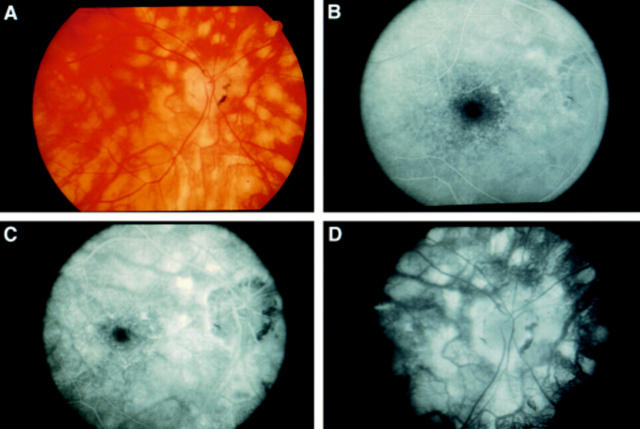
(A) Photograph of the right posterior pole of a patient with long standing birdshot retinochoroidopathy, showing diffuse birdshot lesions and circumpapillary retinal atrophy. (B), (C), and (D) Early, mid, and late phases respectively of fluorescein angiography of the same eye, demonstrating staining of birdshot lesions.
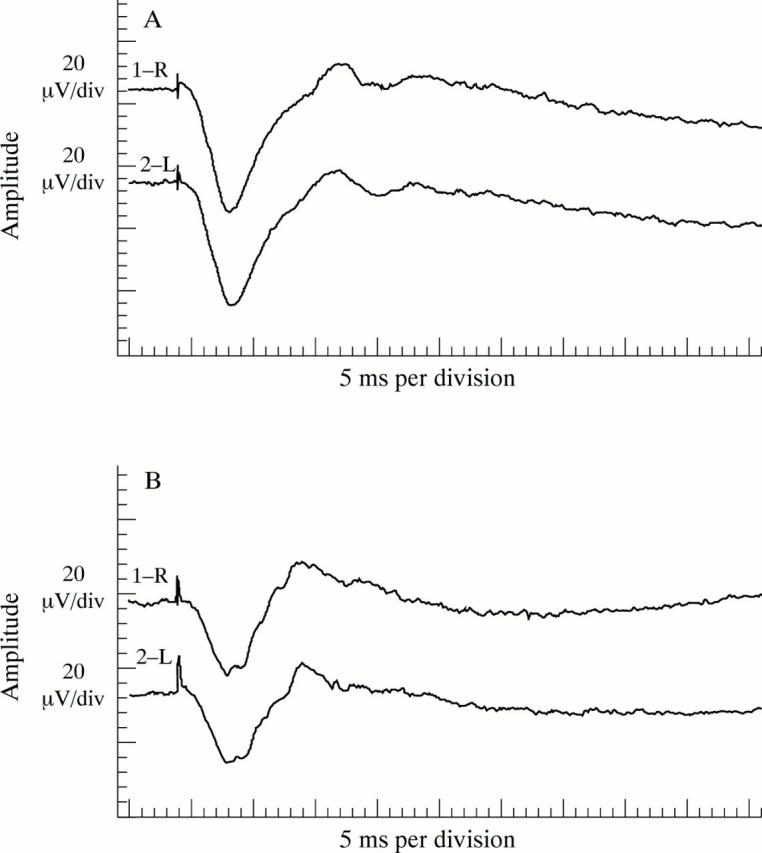
Electroretinogram maximal retinal responses of two patients with birdshot retinochoroidopathy. (A) A normal a-wave amplitude and moderately reduced b-wave amplitude, resulting in an abnormally low b- to a-wave ratio, suggests more compromise of intermediate than outer retinal layers. (B) Equally reduced a- and b-wave amplitudes, resulting in a normal b- to a-wave ratio, suggests photoreceptor involvement.
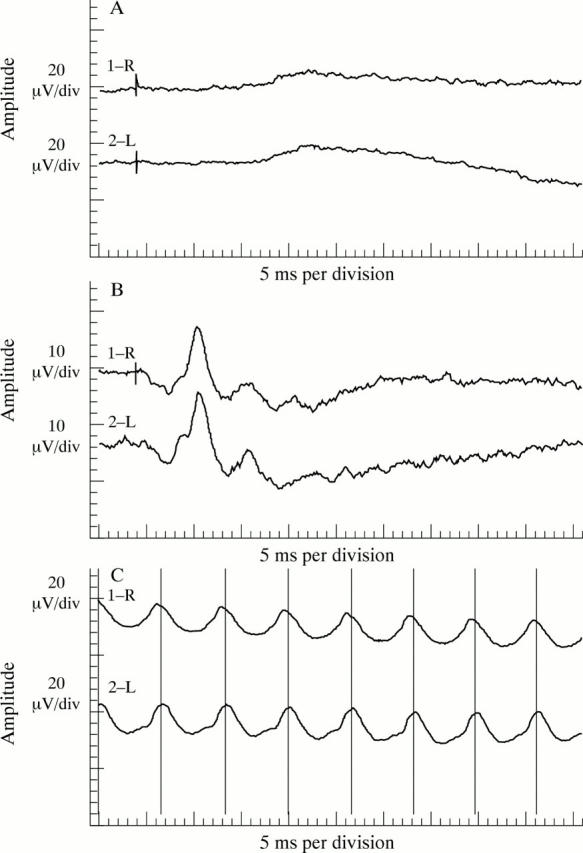
Electroretinogram rod mediated, cone mediated, and flicker responses of the patient whose maximal retinal response is shown in Figure 3B. (A) Rod mediated responses have a reduced amplitude. (B) Cone mediated responses have a less reduced amplitude. (C) Flicker responses, which cones generate, have a reduction in amplitude equal to that of the cone mediated responses.
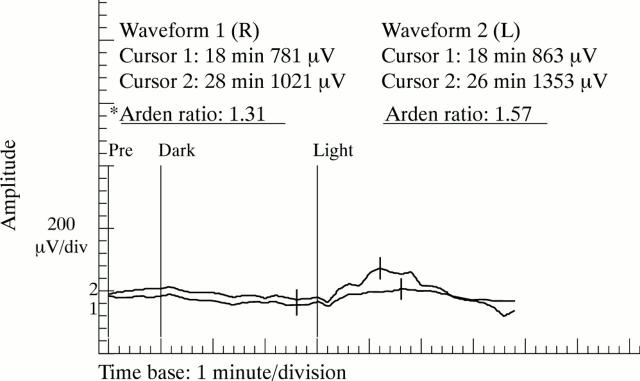
Electro-oculogram of a patient with birdshot retinochoroidopathy. Dark trough and light peak amplitudes and light peak implicit times are within the normal range for both eyes. The Arden ratio is below the normal range for the right eye and at the low end of the normal range for the left eye. *Normal Arden ratio: mean 2.51 (SD 0.48); range 1.56-3.46.
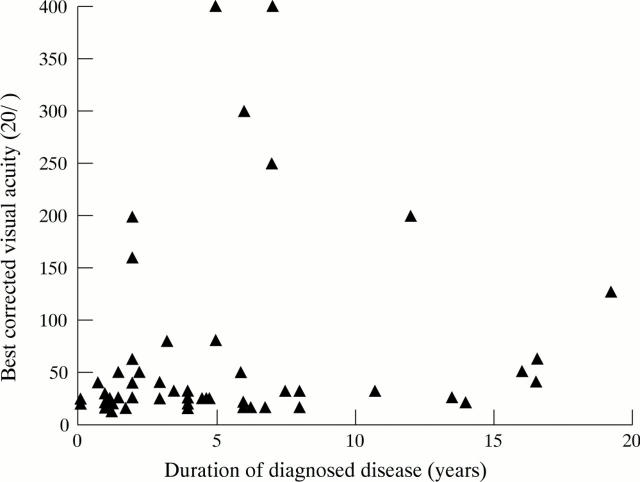
Best corrected visual acuity of the better sighted eye versus duration of diagnosed disease for the NEI birdshot population, except for one eye with finger counting vision and three patients (six eyes) whose duration of diagnosed disease was unavailable (n=55).
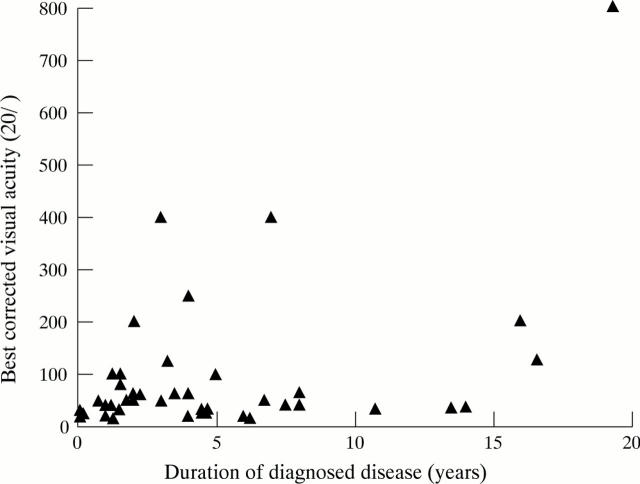
Best corrected visual acuity of the worse sighted eye versus duration of diagnosed disease for the NEI birdshot population, except for five eyes with finger counting vision, two eyes with hand movement vision, two eyes that had been enucleated due to sequelae of cataract extraction, and three patients (six eyes) whose duration of diagnosed disease was unavailable (n=45).
References
Publication types
MeSH terms
LinkOut - more resources
Full Text Sources