. 1999 Aug;73(8):6526-32.
doi: 10.1128/JVI.73.8.6526-6532.1999.

Nonproductive human immunodeficiency virus type 1 infection in nucleoside-treated G0 lymphocytes

Affiliations

Nonproductive human immunodeficiency virus type 1 infection in nucleoside-treated G0 lymphocytes

Y D Korin et al. J Virol. 1999 Aug.

Abstract

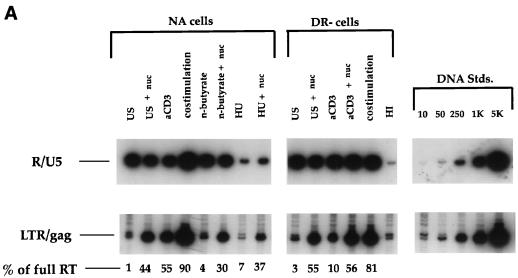
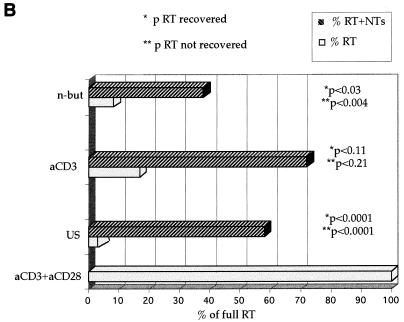
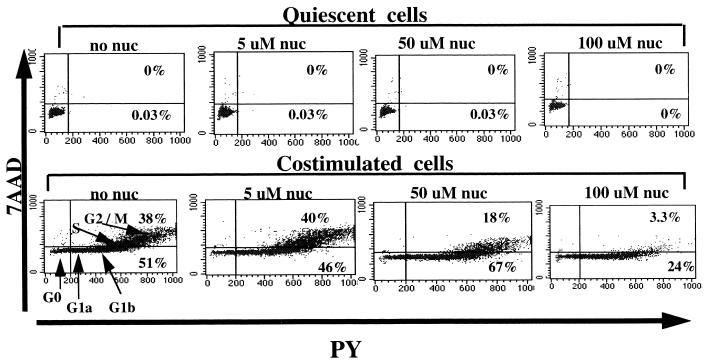
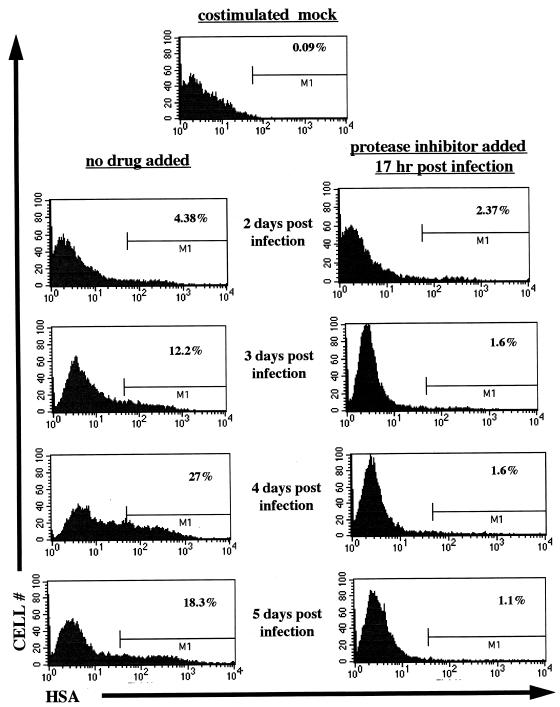
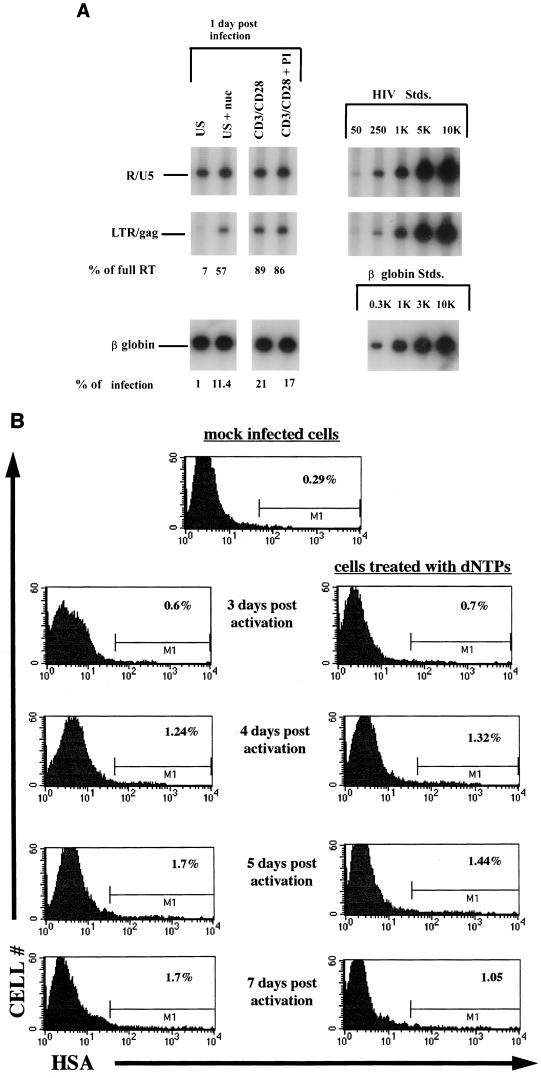
Productive infection by human immunodeficiency virus type 1 (HIV-1) requires the activation of target cells. Infection of quiescent peripheral CD4 lymphocytes by HIV-1 results in incomplete, labile, reverse transcripts. We have previously identified G1b as the cell cycle stage required for the optimal completion of the reverse transcription process in T lymphocytes. However, the mechanism(s) involved in the blockage of reverse transcription remains undefined. In this study we investigated whether nucleotide levels influence viral reverse transcription in G0 cells. For this purpose the role of the enzyme ribonucleotide reductase was bypassed, by adding exogenous deoxyribonucleosides to highly purified T cells in the G0 or the G1a phase of the cell cycle. Our data showed a significant increase in the efficiency of the reverse transcription process following the addition of the deoxyribonucleosides. To define the stability and functionality of these full reverse transcripts, we used an HIV-1 reporter virus that expresses the murine heat-stable antigen on the surfaces of infected cells. Following activation of infected quiescent cells treated with exogenous nucleosides, no increased rescue of productive infection was seen. Thus, in addition to failure to complete reverse transcription, there was an additional nonreversible blockage of productive infection in quiescent T cells. These experiments have important relevance in the gene therapy arena, in terms of improving the ability of lentivirus vectors to enter metabolically inactive cells, such as hematopoietic stem cells.


Figures

FIG. 1
FIG. 1
(A) Effect of exogenous nucleosides on HIV reverse transcription. Cells treated as indicated were infected with NL4-3 in the presence or absence of 10 μM of deoxynucleosides (nuc) per ml. US, unstimulated cells; αCD3, cells stimulated with αCD3 alone; costimulation, cells stimulated with αCD3 and αCD28; n-butyrate, costimulated cells treated with n-butyrate prior to costimulation; HU, costimulated cells treated with HU prior to costimulation; HI, cells infected with a heat-inactivated virus, as a negative control for reverse transcription; RT, reverse transcripts. At 17 h postinfection, DNA was harvested and subjected to quantitative PCR with the primer pairs for the R and U5 regions and the LTR and gag regions to detect initiation and completion of the HIV-1 reverse transcription process. Quantitative standards (Stds.) for 10 to 5,000 copies of viral DNA amplified in parallel are shown on the right. (B) Statistical analysis to assess the significance of the nucleoside-induced rescue of the reverse transcription process. The data are compiled from seven experiments to assess the effect of nucleoside addition on amounts of complete reverse transcripts in infected cells arrested in the G0 (US [for unstimulated]) or G1a (αCD3 and n-but [for n-butyrate]) phase of the cell cycle, compared to that on fully activated cells (αCD3+αCD28). *p, P values for the significance of the level of reverse transcripts (RT) recovered compared to the level recovered in cells without nucleoside addition; **p, P values for the significance of the level of reverse transcripts not recovered in nucleotide (NT)-treated cells compared to the level not recovered in the costimulated control cells.
FIG. 1
FIG. 1
(A) Effect of exogenous nucleosides on HIV reverse transcription. Cells treated as indicated were infected with NL4-3 in the presence or absence of 10 μM of deoxynucleosides (nuc) per ml. US, unstimulated cells; αCD3, cells stimulated with αCD3 alone; costimulation, cells stimulated with αCD3 and αCD28; n-butyrate, costimulated cells treated with n-butyrate prior to costimulation; HU, costimulated cells treated with HU prior to costimulation; HI, cells infected with a heat-inactivated virus, as a negative control for reverse transcription; RT, reverse transcripts. At 17 h postinfection, DNA was harvested and subjected to quantitative PCR with the primer pairs for the R and U5 regions and the LTR and gag regions to detect initiation and completion of the HIV-1 reverse transcription process. Quantitative standards (Stds.) for 10 to 5,000 copies of viral DNA amplified in parallel are shown on the right. (B) Statistical analysis to assess the significance of the nucleoside-induced rescue of the reverse transcription process. The data are compiled from seven experiments to assess the effect of nucleoside addition on amounts of complete reverse transcripts in infected cells arrested in the G0 (US [for unstimulated]) or G1a (αCD3 and n-but [for n-butyrate]) phase of the cell cycle, compared to that on fully activated cells (αCD3+αCD28). *p, P values for the significance of the level of reverse transcripts (RT) recovered compared to the level recovered in cells without nucleoside addition; **p, P values for the significance of the level of reverse transcripts not recovered in nucleotide (NT)-treated cells compared to the level not recovered in the costimulated control cells.
FIG. 2
FIG. 2
Effect of exogenous nucleosides on cell cycle. Cell cycle analysis of unstimulated (upper panels) and costimulated (lower panels) cells cultured in the absence or presence of increasing concentrations of exogenous nucleosides (nuc) for 2 days. The different phases of the cell cycle are shown in the lower left panel. Percentages of cells at the different phases of the cell cycle are indicated inside the respective quadrants for each of the conditions. 7AAD, 7-amino-actinomycin D. PY, pyronin Y.
FIG. 3
FIG. 3
Postinfection addition of PI prevents HIV replication. (Right panels) PI (100 nM) was added 17 h following infection of costimulated cells with the reporter virus NL-r-HSAS. (Left panels) Cells that received no drug. At the indicated time points, cells were collected and stained for the virus-encoded HSA surface marker. Percentages of HSA+ cells are indicated at the M1 gate in the corresponding histograms. Results with mock-infected cells are shown in the top panel.
FIG. 4
FIG. 4
(A) HIV-1 reverse transcription of cells infected with NL-r-HSAS following addition of exogenous nucleosides. Unstimulated and costimulated cells were infected with 3 μg of p24 of NL-r-HSAS per 106 cells in the presence or absence of 10 μM of deoxynucleosides (nuc) per ml. Seventeen hours later DNA was harvested and subjected to quantitative PCR with the primer pairs for the R-U5 and LTR-gag regions in the viral DNA and with a primer for the β-globin gene of the genomic DNA. Percentages of initiated reverse transcripts that completed the reverse transcription process (% of full RT) as well as percentages of cells in the population that harbor complete reverse transcription as determined by assessing levels of LTR and gag per β-globin signal (% of infection) are indicated for each of the conditions. US, unstimulated; CD3+CD28, costimulated. Quantitative standards (Stds.) are shown on the right for each primer pair and for the β-globin primer. (B) Effect of nucleoside addition on viral rescue. The quiescent or nucleoside-treated quiescent cells shown in panel A were costimulated 17 h postinfection in the presence of 100 nM PI. At the indicated time points cells were collected and stained for the virus-encoded HSA surface marker. Percentages of HSA+ cells are indicated in each of the corresponding histograms. The results are representative of three separate experiments.

References

    1. Chen I S, Temin H M. Establishment of infection by spleen necrosis virus: inhibition in stationary cells and the role of secondary infection. J Virol. 1982;41:183–191. - PMC - PubMed
    1. Cohen A, Barankiewicz J, Lederman H M, Gelfand E W. Purine and pyrimidine metabolism in human T lymphocytes. Regulation of deoxyribonucleotide metabolism. J Biol Chem. 1983;258:12334–12340. - PubMed
    1. Eriksson S, Thelander L, Akerman M. Allosteric regulation of calf thymus ribonucleoside diphosphate reductase. Biochemistry. 1979;18:2948–2952. - PubMed
    1. Gao W Y, Agbaria R, Driscoll J S, Mitsuya H. Divergent anti-human immunodeficiency virus activity and anabolic phosphorylation of 2′,3′-dideoxynucleoside analogs in resting and activated human cells. J Biol Chem. 1994;269:12633–12638. - PubMed
    1. Gao W Y, Cara A, Gallo R C, Lori F. Low levels of deoxynucleotides in peripheral blood lymphocytes: a strategy to inhibit human immunodeficiency virus type 1 replication. Proc Natl Acad Sci USA. 1993;90:8925–8928. - PMC - PubMed

Publication types

Substances