Comparative Study
. 1999 Jun;9(6):550-7.

The genomic tree as revealed from whole proteome comparisons

Affiliations
Comparative Study

The genomic tree as revealed from whole proteome comparisons

F Tekaia et al. Genome Res. 1999 Jun.

Abstract

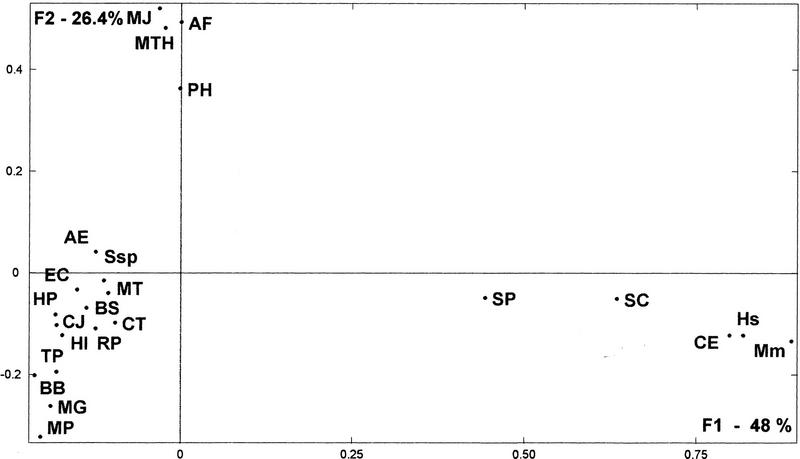
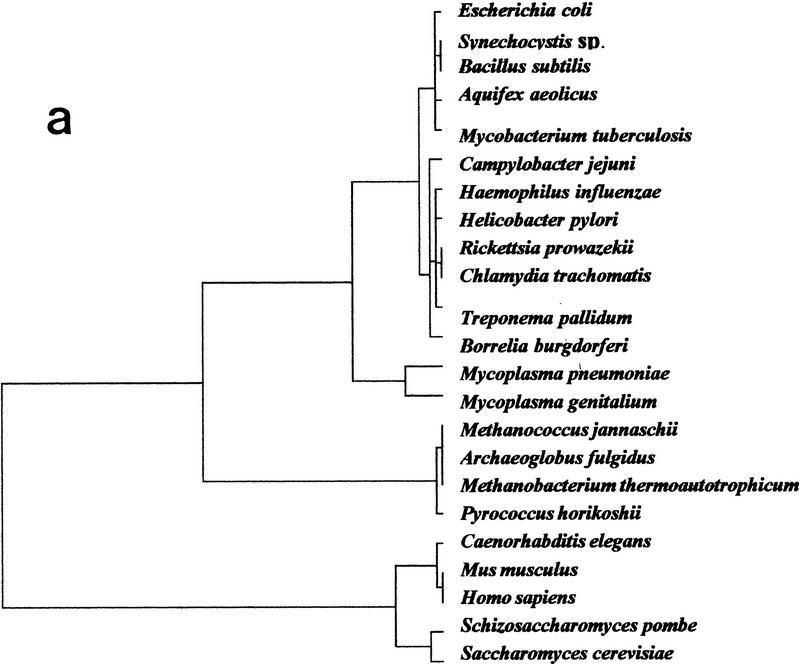
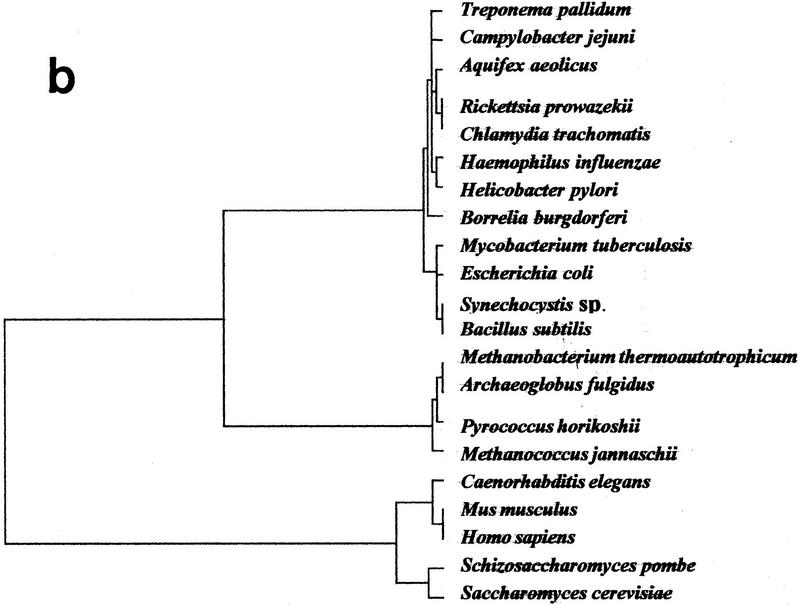
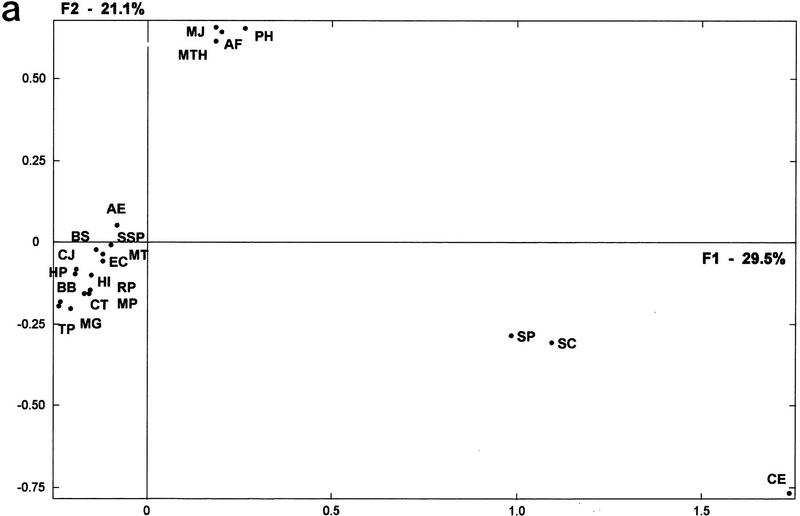
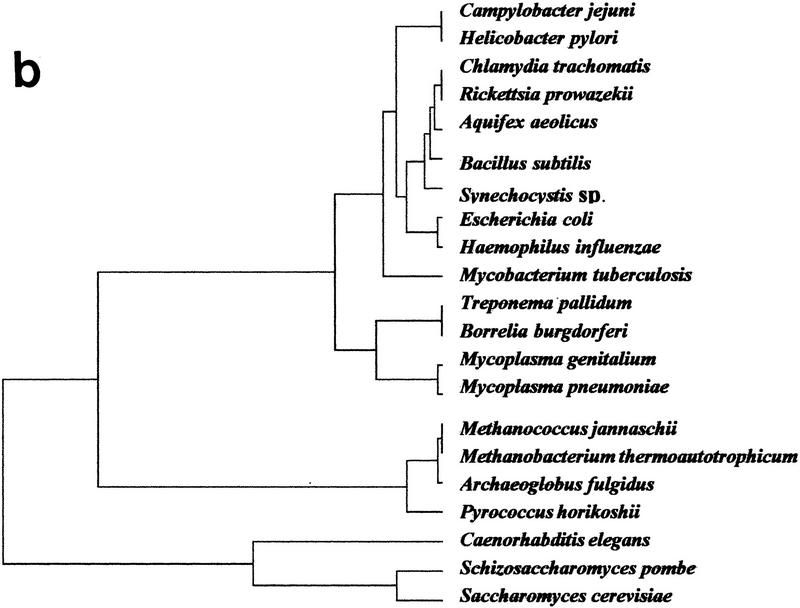
The availability of a number of complete cellular genome sequences allows the development of organisms' classification, taking into account their genome content, the loss or acquisition of genes, and overall gene similarities as signatures of common ancestry. On the basis of correspondence analysis and hierarchical classification methods, a methodological framework is introduced here for the classification of the available 20 completely sequenced genomes and partial information for Schizosaccharomyces pombe, Homo sapiens, and Mus musculus. The outcome of such an analysis leads to a classification of genomes that we call a genomic tree. Although these trees are phenograms, they carry with them strong phylogenetic signatures and are remarkably similar to 16S-like rRNA-based phylogenies. Our results suggest that duplication and deletion events that took place through evolutionary time were globally similar in related organisms. The genomic trees presented here place the Archaea in the proximity of the Bacteria when the whole gene content of each organism is considered, and when ancestral gene duplications are eliminated. Genomic trees represent an additional approach for the understanding of evolution at the genomic level and may contribute to the proper assessment of the evolutionary relationships between extant species.


Figures

Figure 1
Figure 1
Factorial representation of the weight of ancestral duplication and common ancestry in each genome, obtained by the multidimensional correspondence analysis method. First and second factorial axes (F1 and F2) represent, respectively, 48% and 26.4% of total information included in the ancestry weight matrix resulting from predicted gene product comparisons (see Methods). Dots represent the distribution of the surveyed organisms (abbreviations are as in Table 1).
Figure 2
Figure 2
Genomic tree. (a) This tree is obtained by a hierarchical classification of the organisms on the basis of their neighborhood distances. Distances between all pairs of organisms are calculated in the factorial space obtained by correspondence analysis. Horizontal lines between nodes are proportional to their similarity. (b) Same tree excluding data from M. genitalium and M. pneumoniae.
Figure 2
Figure 2
Genomic tree. (a) This tree is obtained by a hierarchical classification of the organisms on the basis of their neighborhood distances. Distances between all pairs of organisms are calculated in the factorial space obtained by correspondence analysis. Horizontal lines between nodes are proportional to their similarity. (b) Same tree excluding data from M. genitalium and M. pneumoniae.
Figure 3
Figure 3
(a) Factorial representation of the constituent ancestry in each genome. First and second axes (F1 and F2) represent, respectively, 29.5% and 21.1% of the total information included in the ancestry weight matrix resulting from the organism’s partitions (see Methods). Organismal distribution on this factorial plane is very similar to that in Fig. 1. Human and mouse, for which no accurate ancestral gene duplications can be presently calculated, were not considered in this analysis (abbreviations are as in Table 1). (b) Genomic tree for the considered organisms (minus human and mouse) as obtained from the whole factorial space resulting from the corresponding analysis (see Fig. 2a for methods of analysis).
Figure 3
Figure 3
(a) Factorial representation of the constituent ancestry in each genome. First and second axes (F1 and F2) represent, respectively, 29.5% and 21.1% of the total information included in the ancestry weight matrix resulting from the organism’s partitions (see Methods). Organismal distribution on this factorial plane is very similar to that in Fig. 1. Human and mouse, for which no accurate ancestral gene duplications can be presently calculated, were not considered in this analysis (abbreviations are as in Table 1). (b) Genomic tree for the considered organisms (minus human and mouse) as obtained from the whole factorial space resulting from the corresponding analysis (see Fig. 2a for methods of analysis).

Similar articles

Cited by

References

    1. Altschul SF, Gish W, Miller W, Myers EW, Lipman DJ. Basic local alignment search tool. J Mol Biol. 1990;215:403–410. - PubMed
    1. Andersson SG, Zomorodipour A, Andersson JO, Sicheritz-Ponten T, Alsmark UC, Podowski RM, Naslund AK, Eriksson AS, Winkler HH, Kurland CG. The genome sequence of Rickettsia prowazekii and the origin of mitochondria. Nature. 1998;396:133–140. - PubMed
    1. Benzecri J-P. L’analyse des données. Vol 2: L’analyse des correspondances. Paris, France: Dunod; 1973.
    1. Blattner FR, Plunkett G, III, Bloch CA, Perna NT, Burland V, Riley M, Collado-Vides J, Glasner JD, Rode CK, Mayhew GF, et al. The complete genome sequence of Escherichia coli K-12. Science. 1997;277:1453–1462. - PubMed
    1. Boguski MS, Schuler GD. Establishing a human transcript map. Nat Genet. 1995;10:369–371. - PubMed

Publication types

LinkOut - more resources