. 1999 Jul 15;19(14):5942-54.
doi: 10.1523/JNEUROSCI.19-14-05942.1999.

Modulation of glioma cell migration and invasion using Cl(-) and K(+) ion channel blockers

Affiliations

Modulation of glioma cell migration and invasion using Cl(-) and K(+) ion channel blockers

L Soroceanu et al. J Neurosci. .

Abstract

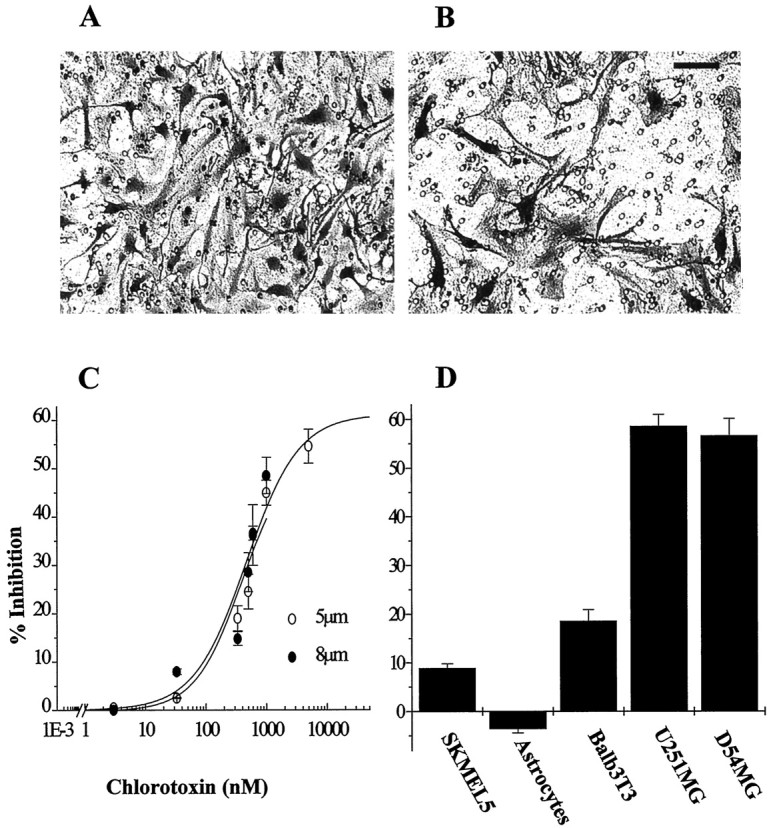
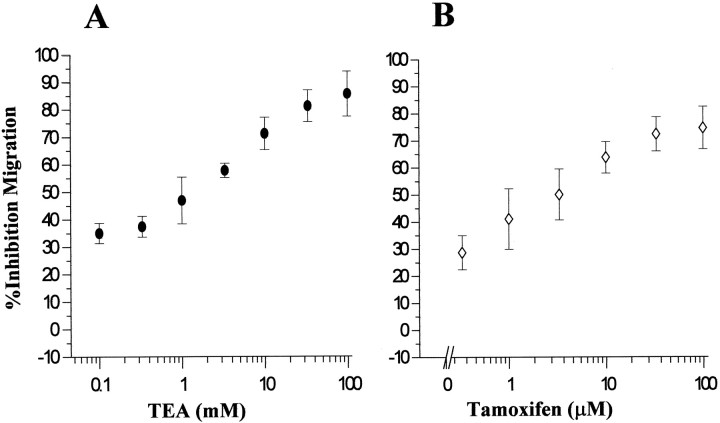
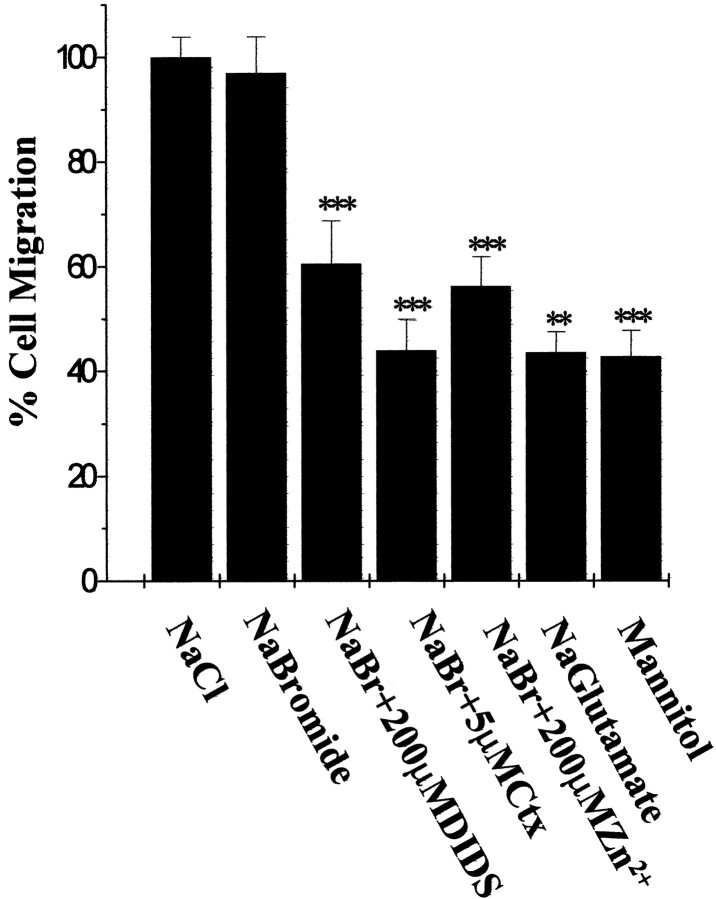
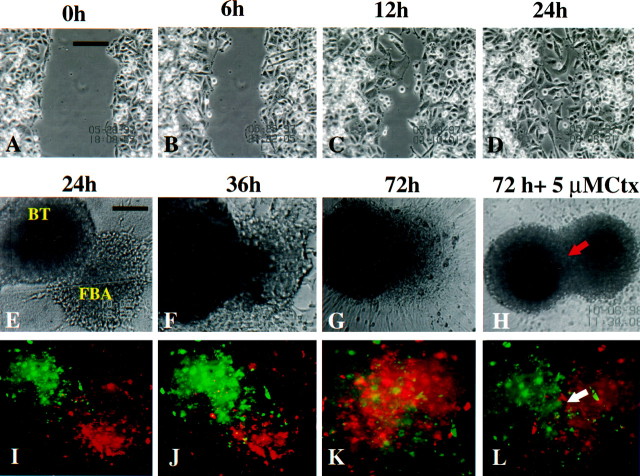
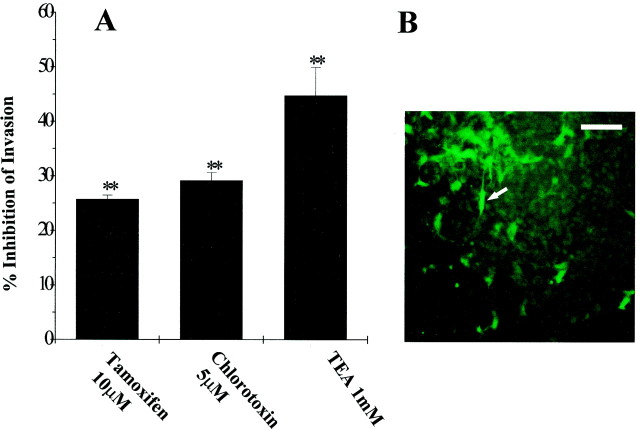
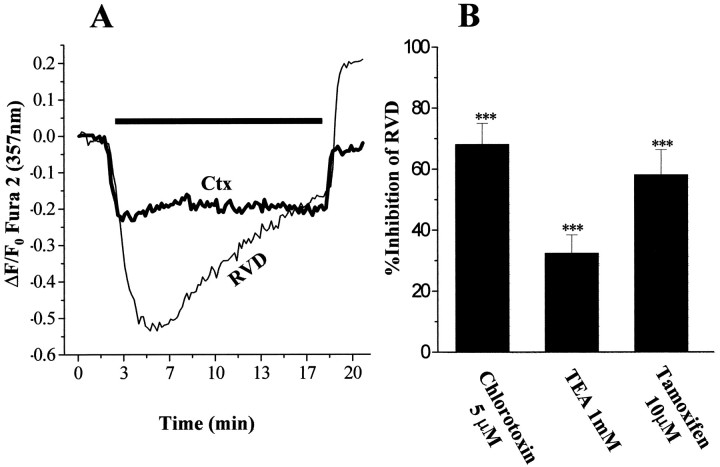
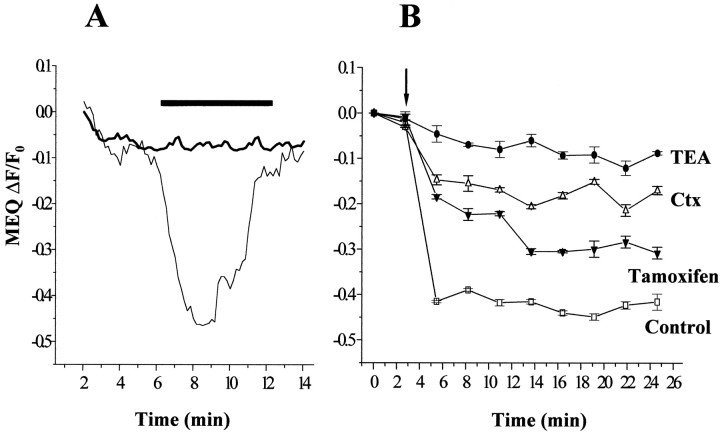
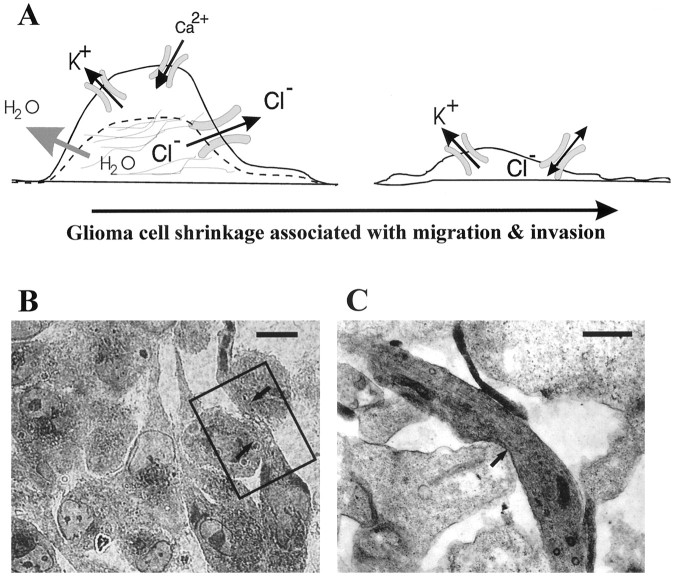
Human malignant gliomas are highly invasive tumors. Mechanisms that allow glioma cells to disseminate, migrating through the narrow extracellular brain spaces are poorly understood. We recently demonstrated expression of large voltage-dependent chloride (Cl(-)) currents, selectively expressed by human glioma cells in vitro and in situ (Ullrich et al., 1998). Currents are sensitive to several Cl(-) channel blockers, including chlorotoxin (Ctx), (Ullrich and Sontheimer; 1996; Ullrich et al; 1996), tetraethylammonium chloride (TEA), and tamoxifen (Ransom and Sontheimer, 1998). Using Transwell migration assays, we show that blockade of glioma Cl(-) channels specifically inhibits tumor cell migration in a dose-dependent manner. Ctx (5 microM), tamoxifen (10 microM), and TEA (1 mM) also prevented invasion of human glioma cells into fetal rat brain aggregates, used as an in vitro model to assess tumor invasiveness. Anion replacement studies suggest that permeation of chloride ions through glioma chloride channel is obligatory for cell migration. Osmotically induced cell swelling and subsequent regulatory volume decrease (RVD) in cultured glioma cells were reversibly prevented by 1 mM TEA, 10 microM tamoxifen, and irreversibly blocked by 5 microM Ctx added to the hypotonic media. Cl(-) fluxes associated with adaptive shape changes elicited by cell swelling and RVD in glioma cells were inhibited by 5 microM Ctx, 10 microM tamoxifen, and 1 mM TEA, as determined using the Cl(-)-sensitive fluorescent dye 6-methoxy-N-ethylquinolinium iodide. Collectively, these data suggest that chloride channels in glioma cells may enable tumor invasiveness, presumably by facilitating cell shape and cell volume changes that are more conducive to migration and invasion.


Figures

Fig. 1.
Fig. 1.
A, B, Representative microscopic fields of human glioblastoma cells that have migrated across an 8 μm pore size filter in the presence (B) or absence (A) of 1 μm Ctx. Cells were fixed and stained with crystal violet (see Materials and Methods). Scale bar, 50 μm.C, The ability of Ctx to inhibit Transwell migration of U251MG cells is dose-dependent for both 5 and 8 μm pore size filters. Half-maximal inhibition (IC50) for Ctx is ∼600 nm (log scale). The y-axis represents percentage inhibition calculated as decrease in the number of Ctx-treated cells that migrated across the filters normalized to control conditions. Data points are mean values from three independent experiments ± SD. Continuous lines represent a Langmuir-binding isotherm fitted to data. D, Inhibition of Transwell invasion by 5 μm chlorotoxin is glioma-specific: U251MG and D54MG human malignant glioma cell lines are >60% inhibited, whereas no significant effect is seen on control cell lines. They-axis represents percentage inhibition calculated as decrease in the number of cells that migrated across 8 μm filter in the presence of 5 μm Ctx compared with control conditions.
Fig. 2.
Fig. 2.
Inhibition of Transwell migration of U251MG cells by TEA (A) and tamoxifen (B) is dose-dependent. Each data point represents mean values from three different experiments ± SD. They-axis represents percent inhibition calculated as the decrease in number of cells that migrated through the pores in the presence of TEA or tamoxifen as compared with vehicle-treated cells.
Fig. 3.
Fig. 3.
Effects of ion substitution on Transwell migration of U251MG cells. Results are expressed as percentage of cells that migrated normalized to control conditions (NaCl in migration media). Results represent mean values from three independent experiments ± SD. Statistics were computed from raw data, using ANOVA. ***p < 0.001; ** p < 0.01.
Fig. 4.
Fig. 4.
AD represent time-lapse micrographs of a “scrape-migration” assay. U251MG cells treated with 5 μm Ctx were scarred and monitored for 24 hr. Glioma cell migration into the empty space results in gradual closure of the scar, which is complete at 24 hr, unchanged from control (data not shown). Scale bar, 100 μm. Phase (EH) and fluorescent (IL) micrographs of a confrontation assay between DiO-labeled BTs and DiI-labeled FBAs. The interaction was monitored by video time-lapse microscopy for 72 hr, in the presence or absence of ion channel blockers. H and Lillustrate significant reduction in the invasion of glioma cells into the FBA and preservation of a clear border between the two tissue types; also noticeable is the integrity of normal brain tissue in the presence of chlorotoxin (5 μm; H,L) in contrast to massive infiltration of the fetal rat brain with glioma cells in control conditions (G,K). Scale bars: A,E, 100 μm.
Fig. 5.
Fig. 5.
Slice invasion assay. A, Ten microliters of DiO-labeled glioma cells (106) were plated atop each of the brain slices placed in the top compartment of a two-well culture chamber. After 4–6 d, fluorescently marked tumor cells that had migrated through the neonatal rat brain slice and across the membrane were retrieved on the bottom of the filter and counted under the fluorescence microscope. Entire filter areas were counted in each condition (six filters per condition). Results represent mean values from three independent experiments. Percentage inhibition was calculated as the decrease in the number of drug-treated cells normalized to control. Bonferroni p values were obtained using ANOVA. **p < 0.01. B, Photomicrograph showing a representative field of a tissue culture insert with DiO-labeled glioma cells that successfully invaded the brain slice (arrows). Scale bar, 150 μm.
Fig. 6.
Fig. 6.
A, Swelling-induced volume changes in glioma cells were measured using fura-2 dye excited at its 357 nm isosbestic point. Hypo-osmotic shock results in a rapid decrease in fluorescence intensity that corresponds to the dye dilution after water entry, followed by a slow recovery termed RVD initiated while hypotonic conditions were maintained (bottom thin line). A sharp fluorescence increase above the initial levels was triggered by isotonic wash. Exposure to 5 μm Ctx before and during the hypotonic shock resulted in a marked decrease in cell swelling and virtually abolished RVD (top bold line). Both traces were obtained by averaging recordings from 50 cells. The bar above the traces denotes the duration of exposure to hypotonic solution. B, The degree of recovery was calculated by fitting the fluorescence plot to an exponential function (from microcal Origin version 5.0 software); mean values from three independent experiments for each of TEA (1 mm), Ctx (5 μm), and tamoxifen (10 μm) were normalized to their respective control. Results are presented as percentage inhibition of RVD. Error bars indicate SD. Statistics were computed using ANOVA; ***p < 0.001.
Fig. 7.
Fig. 7.
A, Osmotically induced chloride fluxes in human glioma cells were measured using the Cl-sensitive dye MEQ. Application of a hypotonic solution containing 30 mm NaCl resulted in a rapid fluorescence intensity decrease because of dye quenching, followed by recovery to initial levels after the restoration of iso-osmotic conditions (bottom thin line). In the presence of 1 mm TEA (both in the isotonic and hypotonic media), Cl entry into the cells was significantly prevented (top bold line). Tracesrepresent average responses from 50 cells. The bar abovecorresponds to the duration of exposure to hypotonic media and 30 mm NaCl. B, Glioma cells plated in 96-well plates (5000 cells per well) were pretreated with TEA (1 mm), Ctx (5 μm), or tamoxifen (10 μm) and loaded with the Cl-sensitive dye MEQ. Fluorescence measurements were done using a plate reader. A “chloride pulse” in hypotonic media was administered to glioma cells via microinjectors (100 μl/well, arrow). MEQ fluorescence intensity sharply decreases as a result of dye quenching by Cl ions entering the cell in control conditions (■, bottom trace). In the presence of ion channel blockers, the dye quenching is significantly decreased, 60% in the case of Ctx (▵), 35% by tamoxifen (▴), and >85% by TEA pretreatment (●). The decrease in MEQ fluorescence quenching indicates reduced permeability of the glioma cell membrane to Cl. Traces represent average recordings from four wells (20,000 cells) obtained at nine time intervals after the initial challenge. Error bars indicate SD.
Fig. 8.
Fig. 8.
A, Model representing glioma cell shape and volume-adaptive changes that occur during invasion in spatially restricted conditions. These changes, accompanied by water loss and cytoskeletal rearrangements, are mediated by ion fluxes through Cl and K+ ion channels and other ion transport mechanisms. B, Semithin section through a coculture of tumor spheroids and fetal rat brain aggregates, stained with toluidine blue. Glioma cells are seen advancing through two normal rat brain cells (arrows). Scale bar, 20 μm.C, Area of detail of the same preparation as inB, analyzed by transmission electron microcopy. Glioma cells are easily recognized because of the abundance of ribosomes and other organelles that incorporate lead citrate and give a darker appearance. Arrows indicate area of contact between an elongated tumor cell and two other membranes, presumably of the fetal rat brain. Scale bar, 1 μm.

References

    1. Altamirano J, Brodwick MS, Alvarez -Leefmans FJ. Regulatory volume decrease and intracellular Ca2+ in murine neuroblastoma cells studied with fluorescent probes. J Gen Physiol. 1998;112:145–160. - PMC - PubMed
    1. Andreanski S, Soroceanu L, Flotte ER, Chou J, Markert JM, Gillespie YG, Roizman B, Whitley RJ. Evaluation of genetically engineered herpes simplex viruses as oncolytic agents for human malignant brain tumors. Cancer Res. 1997;57:1502–1509. - PubMed
    1. Bernstein J, Goldberg WJ, Laws ER, Conger D, Morreale V, Wood RL. C6 glioma cell invasion and migration of rat brain after neural homografting: ultrastructure. J Neurosurg. 1990;26:622–628. - PubMed
    1. Biwerski J, Verkman AS. Cell permeable fluorescent indicator for cytosolic chloride. Biochemistry. 1991;30:7879–7883. - PubMed
    1. Bjerkvig R, Tonnesen A, Laerum OD, Backlund E. Multicellular tumor spheroids from human gliomas maintained in organ culture. J Neurosurg. 1990;72:463–475. - PubMed

Publication types

MeSH terms

LinkOut - more resources