. 1999 Jul 15;19(14):6090-101.
doi: 10.1523/JNEUROSCI.19-14-06090.1999.

Synaptic control of spiking in cerebellar Purkinje cells: dynamic current clamp based on model conductances

Affiliations

Synaptic control of spiking in cerebellar Purkinje cells: dynamic current clamp based on model conductances

D Jaeger et al. J Neurosci. .

Abstract

Previous simulations using a realistic model of a cerebellar Purkinje cell suggested that synaptic control of somatic spiking in this cell type is mediated by voltage-gated intrinsic conductances and that inhibitory rather than excitatory synaptic inputs are more influential in controlling spike timing. In this paper, we have tested these predictions physiologically using dynamic current clamping to apply model-derived synaptic conductances to Purkinje cells in vitro. As predicted by the model, this input transformed the in vitro pattern of spiking into a different spike pattern typically observed in vivo. A net inhibitory synaptic current was required to achieve such spiking, indicating the presence of strong intrinsic depolarizing currents. Spike-triggered averaging confirmed that the length of individual intervals between spikes was correlated to the amplitude of the inhibitory conductance but was not influenced by excitatory inputs. Through repeated presentation of identical stimuli, we determined that the output spike rate was very sensitive to the relative balance of excitation and inhibition in the input conductances. In contrast, the accuracy of spike timing was dependent on input amplitude and was independent of spike rate. Thus, information could be encoded in Purkinje cell spiking in a precise spike time code and a rate code at the same time. We conclude that Purkinje cell responses to synaptic input are strongly dependent on active somatic and dendritic properties and that theories of cerebellar function likely need to incorporate single-cell dynamics to a greater degree than is customary.


Figures

Fig. 1.
Fig. 1.
Comparison between distributed (A–C) and focalized (D–F) synaptic input applied to the model. A,D, Top, Somatic membrane potential.Bottom, Dendritic membrane potential averaged over all dendritic compartments. Somatic spikes have only a small effect on the averaged dendritic Vm because of the pronounced dendritic attenuation of high-frequency signals. It should be noted that the main frequency component of an action potential is ∼1000 Hz, which is much higher than the main frequencies of synaptic input.dend, Dendrite. B, Total excitatory (Gsyn+) and inhibitory (Gsyn−) synaptic conductance obtained by adding up conductances from all synapses in the distributed model.E, Combined reversal potential for the synaptic input (Vclamp) in the focalized case. If the somatic Vm matched the trajectory of this potential, no synaptic current would be injected. Note that spike responses in the model coincide with depolarized phases in vclamp(horizontal bars in C,F). C, F, Total synaptic current (Isyn) and dendritic voltage-gated channel current (ICa+K) seen in the simulations. The spikes of synaptic current seen during action potentials in the focal case (F) were caused by the large change in synaptic-driving force during somatic action potentials. Nevertheless, the synaptic spike current was much smaller than the somatic Na and K spike currents and had little effect on the results of the simulations.
Fig. 2.
Fig. 2.
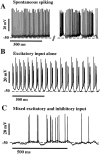
A, Spontaneous activity of a Purkinje cell during whole-cell recording in vitro while synaptic input was blocked pharmacologically is shown. Fast regular somatic spiking (left) is followed a few seconds later by spike bursting that is caused by dendritic calcium spikes (right). After a period of spike bursting, this cell became quiescent for a few seconds before the fast sodium spiking resumed (data not shown). B, When purely excitatory input was given with the dynamic clamp, intrinsic bursting activity sped up substantially. Spike timing was not related to the input under these conditions. C, The application of mixed inhibitory and excitatory conductances resulted in an ongoing irregular spike pattern characteristic of the in vivo state.
Fig. 3.
Fig. 3.
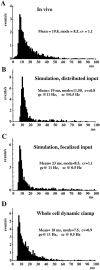
ISI histograms of Purkinje cell spiking for anin vivo recording (A), in the model with distributed (B) and focalized (C) input, and during dynamic current clampingin vitro (D). The ISI distributions were overall similar in all conditions, showing a strong modal peak at ∼10 msec and a tail of long intervals. The total input conductances in the model and under the dynamic current-clamp condition were identical. They were obtained from a computer simulation in which excitatory granule cell (gc) synapses were activated randomly with a mean rate of 11 Hz and inhibitory stellate cells (sc) were activated randomly with a mean rate of 0.5 Hz. The in vivo data were obtained with an extracellular recording from crus IIA in the anesthetized rat [methods described in Jaeger and Bower (1994)]. The small number of very short ISIs in thein vivo distribution is attributable to complex spikes resulting from climbing fiber inputs and was determined by separate complex spike discrimination (data not shown). This input pathway was not included in the modeling or dynamic-clamp studies.
Fig. 4.
Fig. 4.
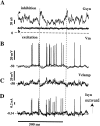
Response of an in vitro neuron to the application of model-based synaptic conductances. A, The applied inhibitory and excitatory synaptic conductance (Gsyn) is shown. B,C, The somatic membrane potential (Vm) follows the fluctuations in the clamping potential (Vclamp) given by the input conductances. Spiking is inhibited during periods of increased inhibition (vertical dashed lines). D, The injected current (Isyn) had an average gain of 0.25 nA for each millivolt of deviation betweenVclamp and Vm. This gain was time-varying (proportional to the sum of excitatory and inhibitory conductances). The mean amplitude of injected current was −0.34 nA, hyperpolarizing the cell.
Fig. 5.
Fig. 5.
Spike-triggered averages of membrane potential (A, C) and synaptic conductances (B, D) in the model (A,B) and with the dynamic clamp in vitro(C, D). Spikes before or after ISIs with durations of 10–13, 16–20, or 30–50 msec were separated into three groups to construct spike-triggered averages of membrane potential (Vm), inhibitory synaptic conductance (Gsyn inhibition), and excitatory synaptic conductance (Gsyn excitation). The data were obtained from 2.5 sec of cell activity for the model and the dynamic clamp.
Fig. 6.
Fig. 6.
Spiking response of a single cell to increases in the constant component of simulated excitation. A, Dot rasters and single traces for three runs in which the amplitude of excitatory synaptic inputs was increased. Dot rasters indicate spike timing for repeated presentations of the same stimulus. The single Vm trace below each dot raster illustrates the membrane potential trajectory for a typical response.B, Cross-correlations for each level of excitation. The cross-correlation was computed between subsequent responses to the same stimulus. The total conductance amplitude corresponded to a gain of 2.0 (see Fig. 7).
Fig. 7.
Fig. 7.
Spiking responses of a single cell with increasing input amplitudes. A, Dot rasters of spiking patterns with repeated presentations of the same input conductances multiplied by the indicated gain factors are shown. The spike frequency increased from 43 to 64 Hz when the input conductance was halved and decreased to 32 Hz when the input conductance was doubled. B, Cross-correlation histograms were computed by correlating spike times in each response with spike times of the next response.C, The fluctuations in the injected current increased proportionally with increasing input conductances; however, the mean currents changed only slightly from −0.4 nA for the gain of 0.5 to −0.48 nA for the gain of 2.0. Inward current is plotteddownward.
Fig. 8.
Fig. 8.
Comparison of spiking behavior for three different recorded Purkinje cells. All cells were stimulated with the identical input conductances. It can be seen that each cell has a very similar response for repeated presentation of the stimulus, whereas the response of different cells to the same stimulus can be quite different.

References

    1. Albus JS. A theory of cerebellar function. Math Biosci. 1971;10:25–61.
    1. Barbour B. Synaptic currents evoked in Purkinje cells by stimulating individual granule cells. Neuron. 1993;11:759–769. - PubMed
    1. Barry PH. JPCalc, a software package for calculating liquid junction potential corrections in patch-clamp, intracellular, epithelial and bilayer measurements and for correcting junction potential measurements. J Neurosci Methods. 1994;51:107–116. - PubMed
    1. Barry PH, Lynch JW. Liquid junction potentials and small cell effects in patch-clamp analysis. J Membr Biol. 1991;121:101–117. - PubMed
    1. Bhalla US, Bower JM. Exploring parameter space in detailed single neuron models: simulations of the mitral and granule cells of the olfactory bulb. J Neurophysiol. 1993;69:1948–1965. - PubMed