. 1999 Jul 15;19(14):6145-56.
doi: 10.1523/JNEUROSCI.19-14-06145.1999.

Neural correlates of perceived brightness in the retina, lateral geniculate nucleus, and striate cortex

Affiliations

Neural correlates of perceived brightness in the retina, lateral geniculate nucleus, and striate cortex

A F Rossi et al. J Neurosci. .

Abstract

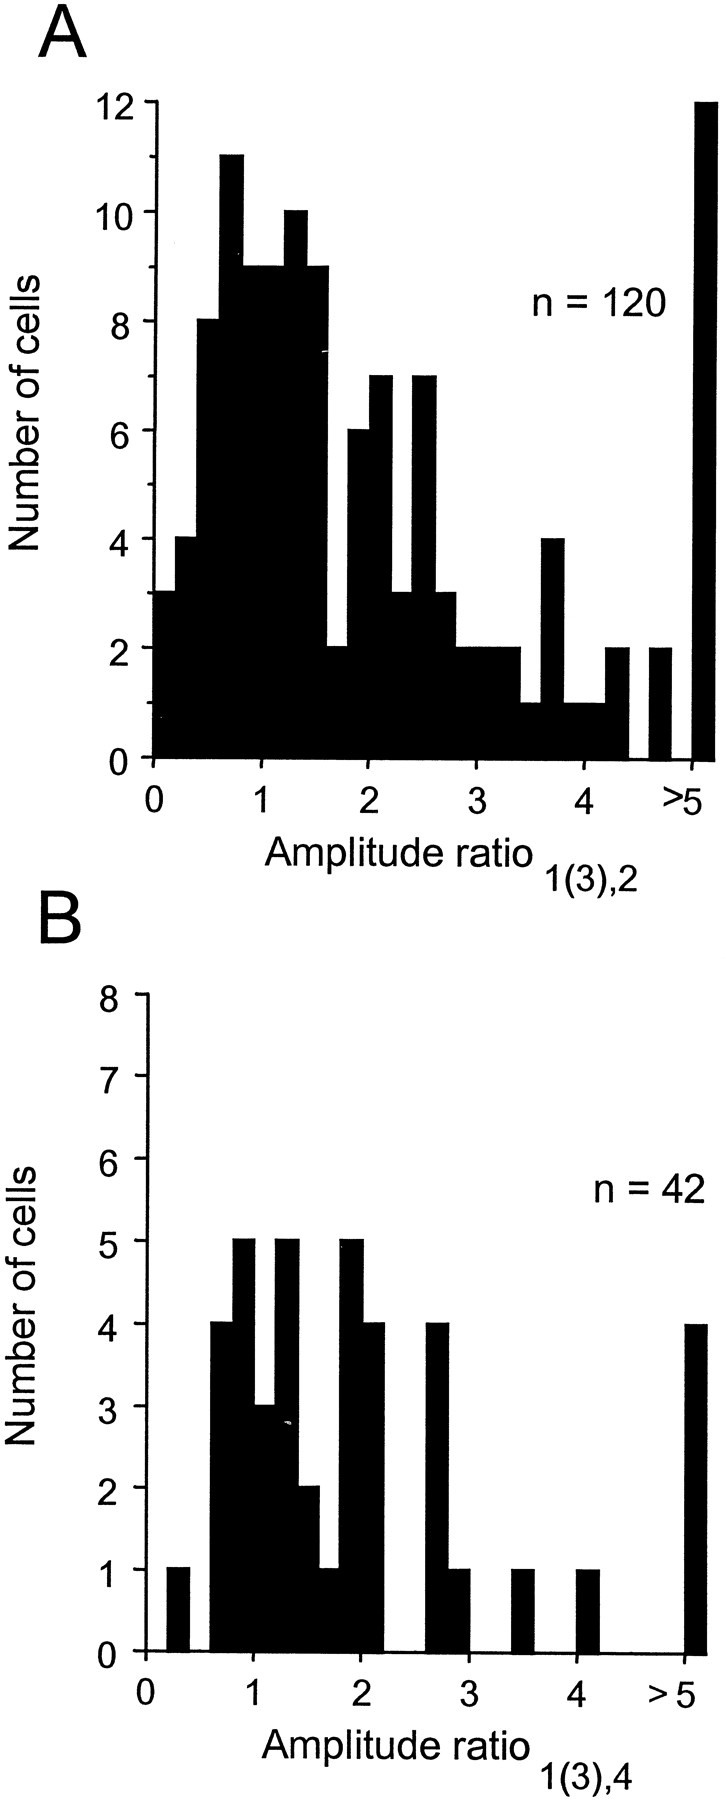
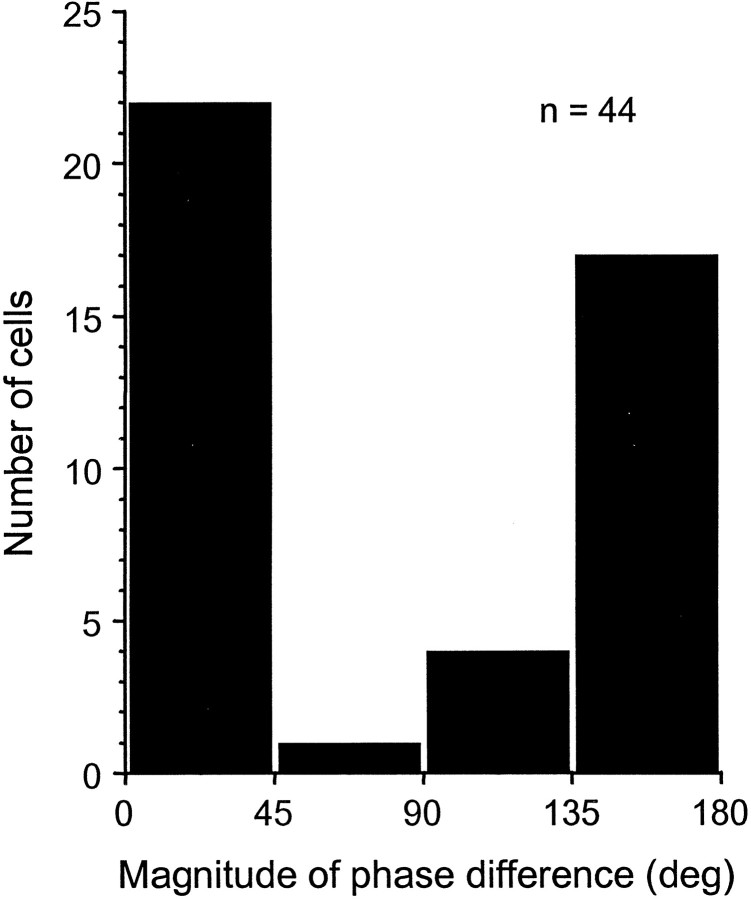
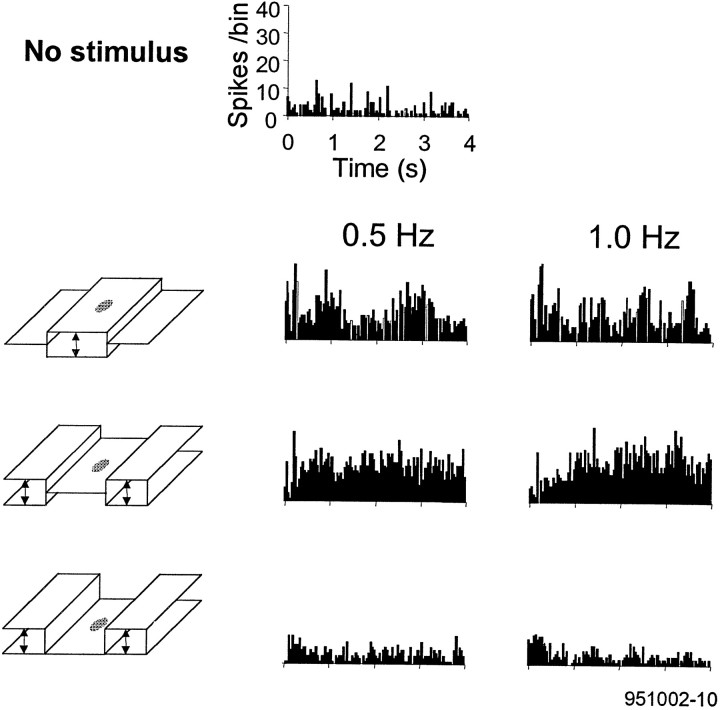
Brightness changes can be induced in a static gray field by modulating the luminance of surrounding areas. We used this induction phenomenon to investigate the neural representation of perceived brightness. Extracellular recordings were made in striate cortex, the lateral geniculate nucleus (LGN), and the optic tract of anesthetized cats using stimuli that produced brightness induction. While a cell's receptive field (RF) was covered by uniform gray illumination, the luminance of rectangular flanking regions was modulated sinusoidally in time, inducing brightness changes in the RF. We looked for a correspondence between the modulation of a cell's response and stimulus conditions that did or did not produce perceptual changes in brightness. We found that the responses of retinal ganglion cell axons in the optic tract were never correlated with brightness. On the other hand, many neurons in striate cortex and a small fraction in the LGN responded in a phase-locked manner at the temporal frequency of the flank modulation, even though the flanks were 3-7 degrees beyond the edges of the RF. Only in striate cortex were cells found that had responses correlated with brightness under all stimulus conditions. These findings suggest that brightness information is explicitly represented in the responses of neurons in striate cortex as part of a neural representation of object surfaces.


Figures

Fig. 1.
Fig. 1.
A, Luminance profile of the induction stimulus. The stimulus was composed of three rectangular regions of equal size. The luminance of the areas flanking the central gray area was modulated (arrows) sinusoidally in time (B), creating the perception that the brightness of the static central area varied in antiphase to the flanks (C). The static center region of the stimulus had a luminance equal to the time-average luminance of the modulated flanks.
Fig. 2.
Fig. 2.
Spatial configurations of the stimuli. Stimuli were presented so that the central area of the stimulus was centered over the receptive field (shown as a gray oval). Stimuli consisted of the following: (1) constant gray center with luminance-modulated flanks (arrows) that resulted in the perception of brightness changes in the region corresponding to the receptive field and (2) black center with luminance-modulated flanks. There was no perceived brightness modulation in the central area containing the receptive field in this condition. (3) Same as (1) with the addition of drifting white (or black) bars over receptive field. Brightness induction was perceived in the area surrounding the bars. (4) Luminance modulation in center with static gray flanks.
Fig. 3.
Fig. 3.
Schematic illustration of the procedure used to quantify the degree of modulation in the response histogram. On theleft of the figure is the response of a neuron to the induction stimulus at a luminance modulation rate of 1 Hz. To assess the degree of modulation in the PSTH, the neural response was multiplied by a sliding squarewave weighting function having a period equal to the inverse of the modulation rate. The gray bands superimposed on the PSTH represent the weighting function in which the activity within the gray zones was summed. A plot of response modulation was constructed (top right) by incrementally shifting the weighting function across 360° of initial phase (left). The amplitude and phase of the response modulation sinusoid was then used to define the modulation amplitude and phase.
Fig. 4.
Fig. 4.
A neuron in striate cortex that responded to luminance modulation outside the RF. Stimulus configurations are shown on the left and the response of the neuron on theright. The RF was 4° wide × 3.5° high, and the static gray central portion of the stimulus was 14° wide × 14° high. At 0.5 and 1.0 Hz, the response was modulated in sync with luminance changes in the flanks, although the flanks were 5° beyond the RF on each side (third row). When the stimulus center was black, induction was perceptually lost along with the neuronal response modulation (fourth row). There was a clear shift in response phase in the induction condition (third row) compared with the condition with luminance modulation within the RF (second row).
Fig. 5.
Fig. 5.
A neuron in striate cortex for which response modulation was most apparent when the baseline firing rate was elevated by drifting white bars of light through the RF (bottom row). Stimulus configurations are shown on theleft with response of the neuron on theright. The second row shows the response of the neuron to drifting white bars on a static gray background. In the bottom three rows, there are three histograms for each stimulus condition corresponding to flank modulation at 0.5, 1.0, and 2.0 Hz. The bar stimuli were drifted through the receptive field at 6.6°/sec. Receptive field size = 4° wide × 3° high; stimulus center = 14 × 10°.
Fig. 6.
Fig. 6.
Comparison of the activity and amplitude ratios for the neurons recorded in striate cortex (A), the LGN (B), and the optic tract (C). Neurons with ratios >1 in either dimension indicate a larger response in the induction condition (stimulus 1) than the center-black condition (stimulus 2). For all neurons shown, the temporal frequency of the luminance modulation was 1.0 Hz.
Fig. 7.
Fig. 7.
A, Distribution of the amplitude ratio1(3),2 for 120 striate neurons. Ratios >1 indicate that the amplitude of the response modulation was greater for induction (stimulus 1 or stimulus 3) than for the center-black control (stimulus 2). B, Distribution of the amplitude ratio1(3),4 for 42 striate neurons in which the amplitude ratio1(3),2 was >2. Ratios >1 indicate that the amplitude of the response modulation was greater for induction (stimulus 1 or stimulus 3) than for luminance modulation within the RF (stimulus 4). Both amplitude ratios were determined for responses to 1 Hz stimuli.
Fig. 8.
Fig. 8.
Distribution of phase differences in the response to induced (stimulus 1) versus direct (stimulus 4) brightness changes within the RF. The luminance modulation rate was 1.0 Hz.
Fig. 9.
Fig. 9.
A, Temporal frequency of luminance modulation affects the response to induction and control stimuli differently. Responses to luminance modulation rates of 0.5, 1, 2, and 4 Hz are shown. B, The amplitude of response modulation plotted as a function of temporal frequency for the striate neuron shown in A. Gray bars represent the response to the induction stimulus (stimulus 1), and black bars represent the response to luminance modulation covering the RF (stimulus 4). The modulation amplitude is expressed as the percentage of the maximum response elicited by stimulus 4.C, Averaged normalized modulation amplitudes for 24 striate neurons plotted as a function of the rate of luminance modulation. The modulation amplitude is expressed as the percentage of the maximum response amplitude elicited by either stimulus for each neuron. In nearly all neurons, the maximum response was elicited by stimulus 4. Gray bars represent the response to stimulus 1, and black bars represent the response to stimulus 4. Error bars are equal to 1 SEM.
Fig. 10.
Fig. 10.
Responses of two geniculate neurons with on-center/off-surround receptive fields. A, A neuron that exhibited an elevated response in the induction condition, but little or no response modulation (third row). There was response modulation to luminance changes within the RF (second row). This cell’s response did not correlate with perceived brightness. B, A neuron that exhibited a modulated response in the induction condition (third row) but no response in the center-black condition (fourth row). Note that there is a difference in the phase of the response to luminance modulation within (second row) and outside (third row) the RF. Although rare in the LGN, this response pattern was correlated with brightness.
Fig. 11.
Fig. 11.
Distribution of the amplitude ratio1(3),2 for neurons recorded in the LGN (n = 42) compared with striate cortex (n = 120). Note that the distribution of neurons for each group is represented as a percentage of the total number of neurons in that group. Ratios >1 indicate that the amplitude of response modulation was greater in the induction condition (stimulus 1) than in the center-black condition (stimulus 2). The amplitude ratios were determined for responses to 1 Hz stimuli. A larger percentage of neurons in striate cortex had ratios >1, indicating that cortical responses were more often correlated with perceived brightness in the induction condition.
Fig. 12.
Fig. 12.
Average amplitude of response modulation plotted as a function of temporal frequency for seven LGN neurons. Gray bars represent the response to the induction stimulus (stimulus 1), and black bars represent the response to luminance modulation covering the RF (stimulus 4). With both stimuli, the modulation amplitude tended to increase with temporal frequency, although not significantly for the induction condition. The modulation amplitude is expressed as the percentage of the maximum response amplitude elicited by either stimulus for each neuron. Error bars are equal to 1 SEM.
Fig. 13.
Fig. 13.
Response of an X-type retinal ganglion cell recorded in the optic tract. In the induction condition (third row) the cell’s response was elevated above the spontaneous firing rate (first row), but the response was not modulated. The response was modulated by luminance changes within the RF (second row).

References

    1. Allman J, Miezin F, McGuinness E. Stimulus specific responses from beyond the classical receptive field: neurophysiological mechanisms for local-global comparisons in visual neurons. Annu Rev Neurosci. 1985;8:407–430. - PubMed
    1. Bravo M, Blake R, Morrison S. Cats see subjective contours. Vision Res. 1988;28:861–865. - PubMed
    1. DeAngelis GC, Robson JG, Ohzawa I, Freeman RD. Organization of suppression in receptive fields of neurons in cat visual cortex. J Neurophysiol. 1992;68:144–163. - PubMed
    1. DeValois RL, Pease PL. Contours and contrast: responses of monkey lateral geniculate nucleus cells to luminance and color figures. Science. 1971;171:694–696. - PubMed
    1. DeValois RL, Webster MA, De Valois KK, Lingelbach B. Temporal properties of brightness and color induction. Vision Res. 1986;26:887–897. - PubMed

Publication types

LinkOut - more resources