. 1999 Aug;82(2):128-33.
doi: 10.1136/hrt.82.2.128.

High resolution in vivo intra-arterial imaging with optical coherence tomography

Affiliations

High resolution in vivo intra-arterial imaging with optical coherence tomography

J G Fujimoto et al. Heart. 1999 Aug.

Abstract

Background: Optical coherence tomography (OCT) is a new method of catheter based micron scale imaging. OCT is analogous to ultrasound, measuring the intensity of backreflected infrared light rather than sound waves.

Objective: To demonstrate the ability of OCT to perform high resolution imaging of arterial tissue in vivo.

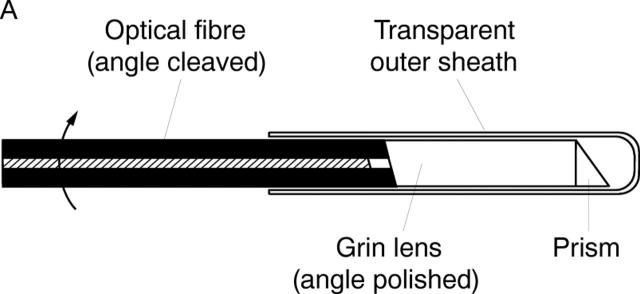
Methods: OCT imaging of the abdominal aorta of New Zealand white rabbits was performed using a 2.9 F OCT imaging catheter. Using an ultrashort pulse laser as a light source for imaging, an axial resolution of 10 micrometer was achieved.

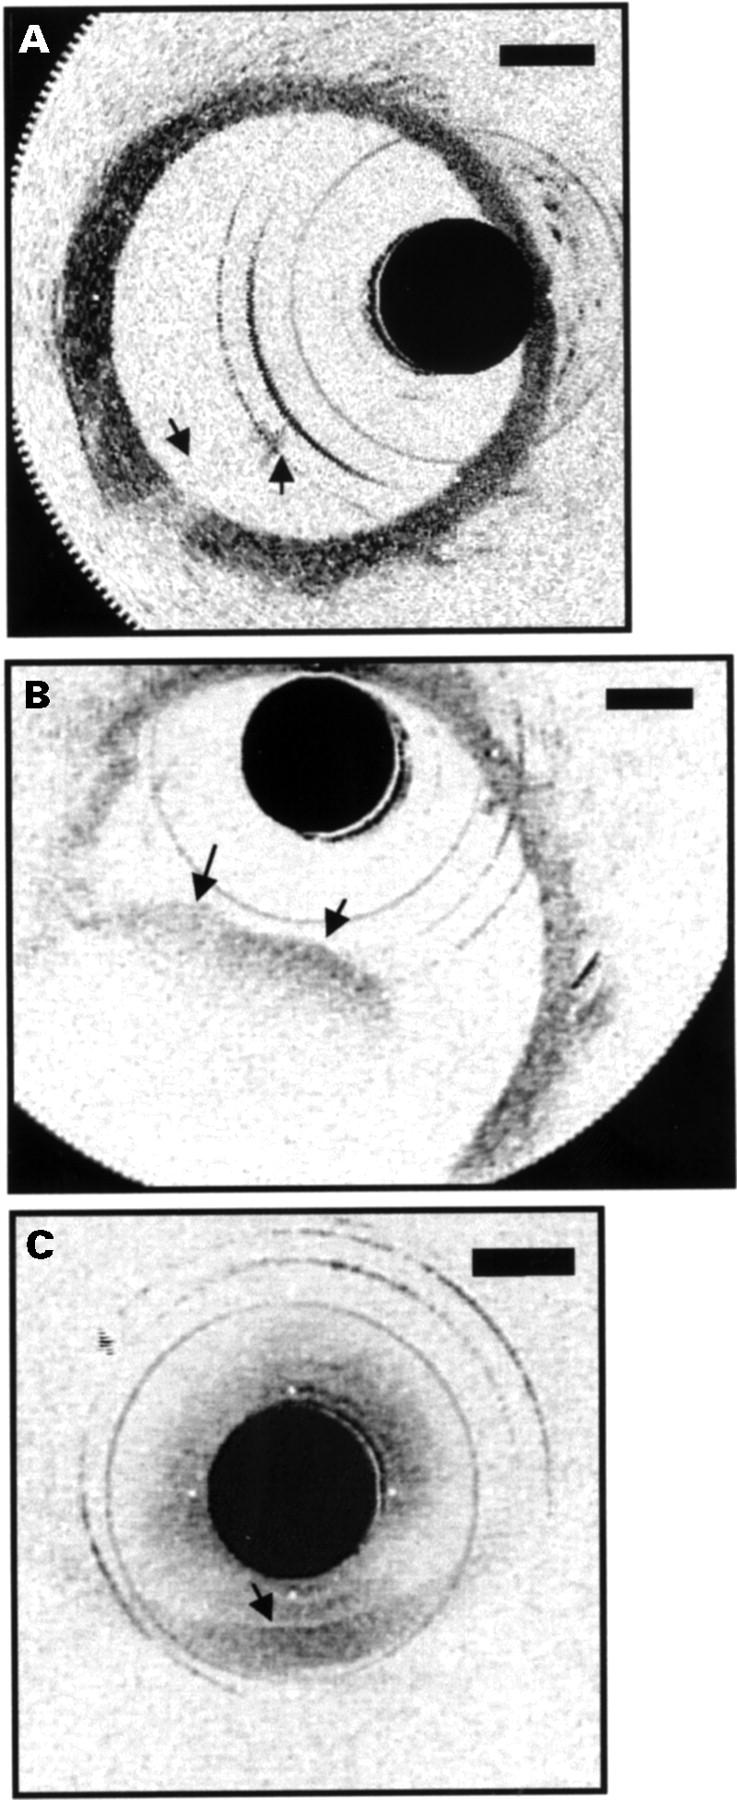
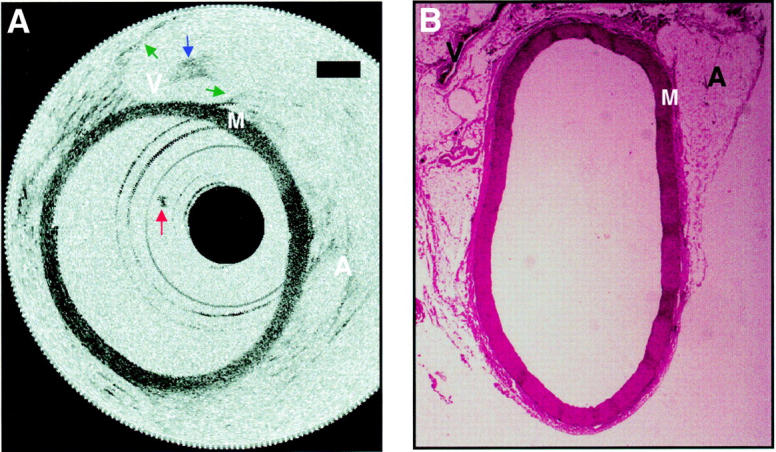
Results: Imaging was performed at 4 frames/second and data were saved in either super VHS or digital format. Saline injections were required during imaging because of the signal attenuation caused by blood. Microstructure was sharply defined within the arterial wall and correlated with histology. Some motion artefacts were noted at 4 frames/second.

Conclusions: In vivo imaging of the rabbit aorta was demonstrated at a source resolution of 10 micrometer, but required the displacement of blood with saline. The high resolution of OCT allows imaging to be performed near the resolution of histopathology, offering the potential to have an impact both on the identification of high risk plaques and the guidance of interventional procedures.


Figures

Figure 1
Figure 1
Schematic of OCT system. Laser source emits pulses that are split evenly, half toward the sample (through the catheter) and half toward the reference arm. If reflected light returning from the tissue and reference mirror arms arrives almost simultaneously, interference will occur. OCT measures the intensity of interference. The rotating mirror of the catheter, galvanometer, and frame grabber are synchronised with a master clock. Data are displayed on a monitor, and saved in either super VHS or digital format.
Figure 2
Figure 2
Schematic of transverse scanning catheter for high speed in vivo intra-arterial imaging. (A) The catheter consisted of an encased, rotating speedometer cable carrying a single mode optical fibre. The beam from the distal end of the fibre was focused by a gradient index (Grin) lens and directed perpendicular to the catheter axis by a microprism which performs circumferential imaging at 4 revolutions/second. (B) The catheter, which has an external diameter of 2.9 F or 0.97 mm.
Figure 2
Figure 2
Schematic of transverse scanning catheter for high speed in vivo intra-arterial imaging. (A) The catheter consisted of an encased, rotating speedometer cable carrying a single mode optical fibre. The beam from the distal end of the fibre was focused by a gradient index (Grin) lens and directed perpendicular to the catheter axis by a microprism which performs circumferential imaging at 4 revolutions/second. (B) The catheter, which has an external diameter of 2.9 F or 0.97 mm.
Figure 3
Figure 3
Movement of blood front in and out of field during saline injections. (A) A small portion of the front is present in the image (arrows), obstructing the view of the vessel wall behind it. (B) Blood now fills almost half the lumen (arrows), resulting in an inability to identify the vessel wall in this region. (C) No saline injection was performed. The wall could only be delineated when the catheter was in direct approximation (arrow).
Figure 4
Figure 4
Aorta image after a saline flush and corresponding histology. (A) The media and surrounding supportive structures are clearly identified. The intima, which is less than 10 µm in diameter, cannot be detected in the images. Backscattering intensity is high in the media "M" and low in the adventitia "A", which consists primarily of loose connective tissue. A small clot adherent to the distal end of the catheter, which formed midway through imaging, is seen in many of the images (red arrow). A structure consistent with the inferior vena cava "V" is imaged through the wall of the aorta. The walls of the inferior vena cava are noted (green arrows), as well as a blood clot within (blue arrow). Bars represent 500 µm in all images. (B) Histology has been included to confirm tissue identification.
Figure 5
Figure 5
Demonstration of motion artefacts while imaging at 4 frames/second. (A) The vessel lumen appears discontinuous (red arrows) since the rate of vessel wall movement exceeds the acquisition rate necessary to produce a 360o revolution. For accurate representations of luminal diameter, acquisition rates will need to be slightly higher. (B) This demonstrates imaging during rapid variations in saline flow. Even though a "wavy" appearance (green arrows) results from the rapid variation in flow, no blurring occurs in sections of the wall. Axial resolution is not influenced because the rate of image data acquisition in the axial direction is much faster than motion of the blood vessel. ("A", adventitia; "M", media.)

References

    1. Thorax. 1968 Jul;23(4):338-9 - PubMed
    1. Science. 1997 Jun 27;276(5321):2037-9 - PubMed
    1. Br Heart J. 1985 Apr;53(4):363-73 - PubMed
    1. N Engl J Med. 1992 Jan 23;326(4):242-50 - PubMed
    1. Circulation. 1994 Jul;90(1):1 - PubMed

Publication types