

Imaging of adenosine bolus transit following intravenous administration: insights into antiarrhythmic efficacy
- PMID: 10409529
- PMCID: PMC1729130
- DOI: 10.1136/hrt.82.2.163
Imaging of adenosine bolus transit following intravenous administration: insights into antiarrhythmic efficacy
Abstract
Objective: To study the effects of the site of intravenous injection of adenosine and to assess the site of action of adenosine in the heart by correlating cardiac effects with bolus transit.
Methods: Ten patients undergoing routine technetium (Tc-99m) gated blood pool ventriculography consented to the coadministration of intravenous adenosine. The dose of adenosine required to produce heart block during sinus rhythm was determined following antecubital vein administration. This dose (6-18 mg) was mixed with Tc-99m and given first into the same antecubital vein (proximal injection) and then repeated into a hand vein (distal injection). The ECG was recorded and the transit of the bolus was imaged using a gamma camera.
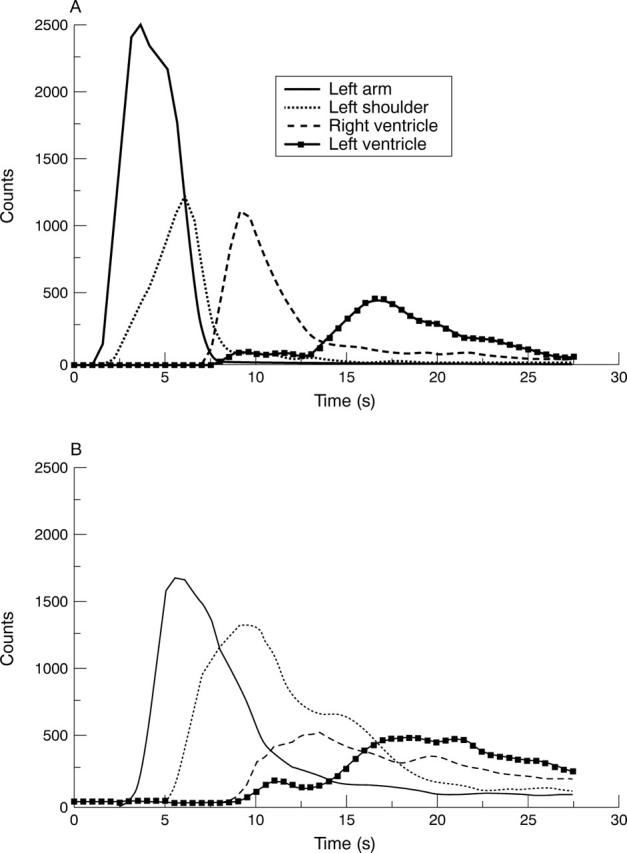
Results: Heart block occurred in all 10 patients (second degree in seven, first degree in three) at (mean (SEM)) 17.5 (1.0) seconds after the proximal injection of adenosine. Distal injection produced heart block in six patients (second degree in two, first degree in four) at 21.9 (4.4) seconds (p < 0.01). In eight of 10 patients the electrophysiological effects were less with distal injection. The onset of heart block was close to the time of peak bolus Tc-99m activity in the left ventricle. Peak bolus activity was delayed (by about three seconds) and the duration of bolus activity in the left ventricle was increased with distal injection compared with proximal injection, at 17.2 (4.2) v 9.2 (3.1) seconds, p < 0.01.
Conclusions: The lesser electrophysiological effects of adenosine following distal intravenous injections were associated with delay in transit time and dispersion of the bolus. The correlation of adenosine induced heart block with bolus activity in the left heart indicated dependence on coronary arterial delivery of adenosine to the atrioventricular node.
Figures


References
MeSH terms
Substances
LinkOut - more resources
Full Text Sources
Other Literature Sources
Medical