. 1999 Aug;19(8):5383-92.
doi: 10.1128/MCB.19.8.5383.

Quantitation of RNA polymerase II and its transcription factors in an HeLa cell: little soluble holoenzyme but significant amounts of polymerases attached to the nuclear substructure

Affiliations

Quantitation of RNA polymerase II and its transcription factors in an HeLa cell: little soluble holoenzyme but significant amounts of polymerases attached to the nuclear substructure

H Kimura et al. Mol Cell Biol. 1999 Aug.

Abstract

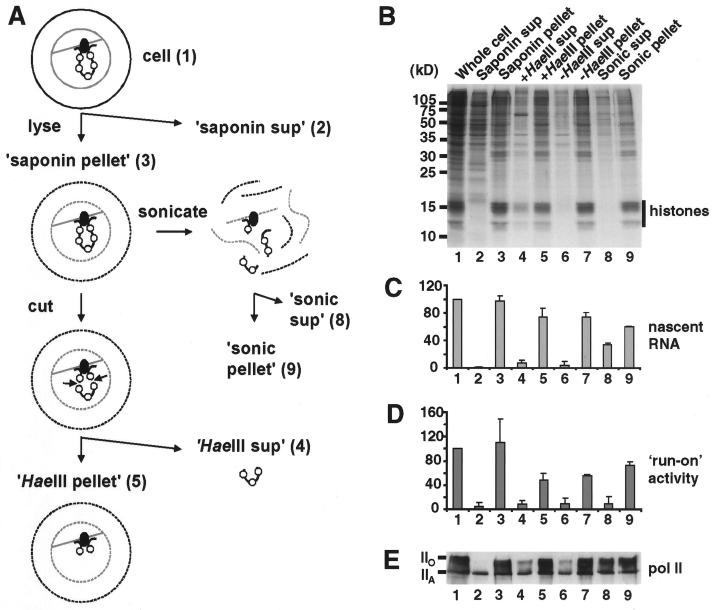
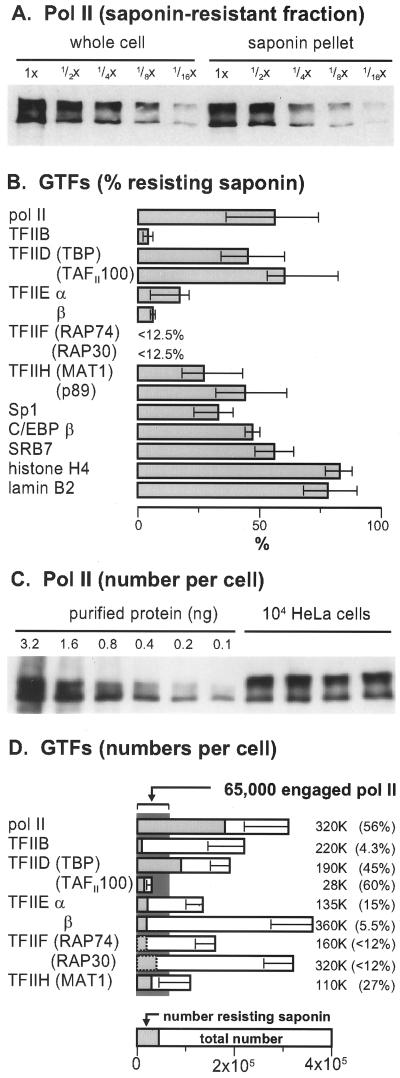
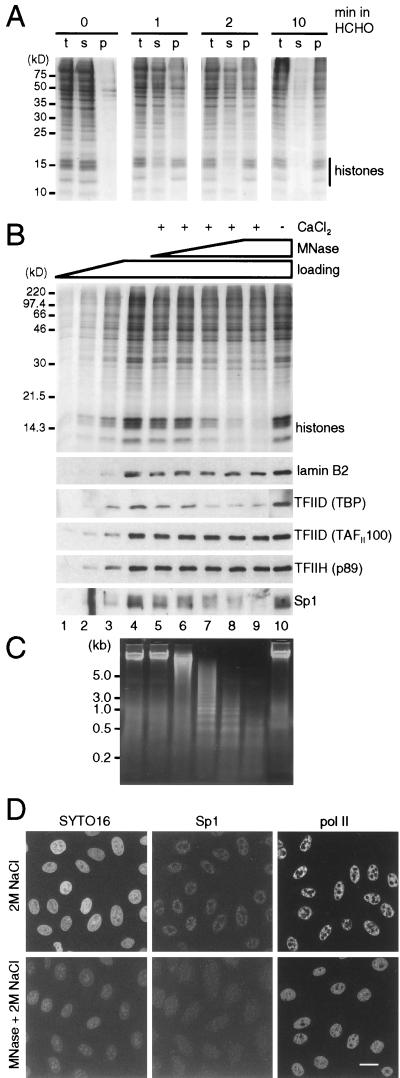
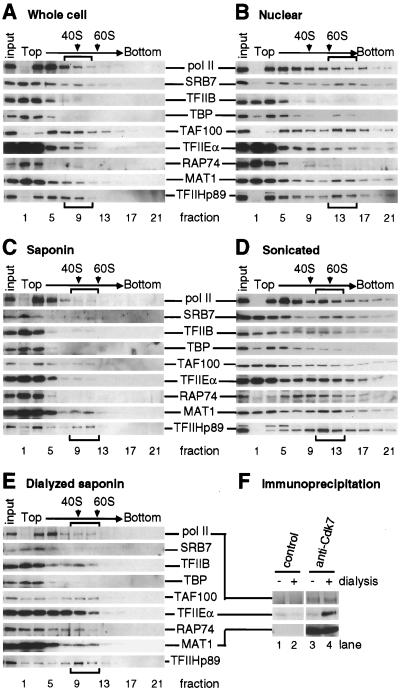
Various complexes that contain the core subunits of RNA polymerase II associated with different transcription factors have been isolated from eukaryotes; their precise molecular constitution depends on the purification procedure. We estimated the numbers of various components of such complexes in an HeLa cell by quantitative immunoblotting. The cells were lysed with saponin in a physiological buffer; approximately 140,000 unengaged polymerases (mainly of form IIA) were released. Only approximately 4,000 of these soluble molecules sedimented in glycerol gradients as holoenzyme-sized complexes. About 180,000 molecules of polymerases (approximately 110,000 molecules of form IIO) and 10,000 to 30,000 molecules of each of TFIIB, TFIIEalpha, TFIIEbeta, TFIIF-RAP74, TFIIF-RAP30, and TFIIH-MAT1 remained tightly associated with the nuclear substructure. Most proteins and run-on activity were retained when approximately 50% of the chromatin was detached with a nuclease, but approximately 45,000 molecules of bound TATA binding protein (TBP) were detached. Similar results were obtained after cross-linking living cells with formaldehyde. The results provide little support for the existence of a large pool of soluble holoenzyme; they are consistent with TBP-promoter complexes in nuclease-sensitive chromatin being assembled into preinitiation complexes attached to the underlying structure.


Figures

FIG. 1
FIG. 1
Distribution of RNA Pol II and nascent RNA in cell fractions. (A) Schematic representation of fraction preparation. HeLa cells (structure 1) were permeabilized with saponin in a physiological buffer and centrifuged to yield the saponin supernatant (structure 2) and pellet (structure 3). After treatment with HaeIII to cut and detach chromatin from the underlying structure, recentrifugation yielded a HaeIII supernatant (structure 4) and pellet (structure 5). Sonication and recentrifugation also gave a sonic supernatant (structure 8) and pellet (structure 9). In all cases, pellets were resuspended in the original volume of physiological buffer. The numbers refer to samples applied to the corresponding lanes in panels B to E. (B) Protein content (photograph of a Coomassie blue-stained gel). Proteins in the various fractions were resolved on an SDS–15% polyacrylamide gel. (C) Nascent RNA. Cells were grown in [3H]uridine for 2.5 min to label nascent RNA before fractionation, and the amount (average of three experiments with standard deviation) of [3H]RNA in each fraction is expressed relative to that in whole cells. (D) Polymerizing activity. After the addition of Sarkosyl, engaged Pols were allowed to incorporate [32P]UTP, and the amount (average of three experiments with standard deviation) of [32P]RNA made is expressed relative to that made by whole cells. (E) Content of RNA Pol II (photograph of an immunoblot). Proteins were separated on a 6% polyacrylamide gel, blotted, and the blot was probed with an antibody that recognized both forms of the largest subunit of Pol II.
FIG. 2
FIG. 2
Number of molecules of the largest subunit of Pol II in a cell. (A) Fraction of Pol II in the saponin pellet. Various loadings of proteins from whole cells and the saponin pellet were resolved on a gel and blotted, and the blot was probed with the Pol II antibody. The two bands seen in the saponin pellet have roughly half the intensity of those seen in whole cells. (B) Percentage of various GTFs resisting extraction with saponin (determined from at least three experiments like that in panel A; error bars show the range). (C) Absolute numbers of Pol II molecules obtained by comparing band intensities given by four different preparations of 104 whole cells with those given by dilutions of known amounts of pure Pol II. (D) Absolute numbers of molecules of various proteins (obtained from at least three experiments like that in panel C; error bars show standard deviation). The total numbers and fraction resistant to saponin are shown.
FIG. 3
FIG. 3
Retention of proteins after detaching chromatin. (A) Immunoblots. Cells were grown in [3H]thymidine for 24 h to label DNA, lysed, incubated with or without HaeIII, and centrifuged; the proteins in the pellet were resolved in gels and blotted; and the filters were probed with antibodies directed against the proteins indicated. The percentage of [3H]DNA remaining in each fraction is shown at the top. Lanes 1 to 4: 1/8×, 1/4×, 1/2×, and 1× loading of lysed cells; lanes 5 to 8: 1× loading of lysed cells treated with 0, 0.1, 0.5, or 2.5 U of HaeIII per ml. (B) DNA and proteins remaining in pellets (average of three experiments). The intensities of bands like those in panel A were measured and are expressed as percentages of those seen in cells treated without HaeIII (lanes 1 to 4 in panel A). Histone levels were determined from gels stained with Coomassie blue. Levels of nascent RNA were determined as follows: cells were allowed to make RNA in [32P]UTP, treated with HaeIII or left untreated, and pelleted, and the amount of [32P]RNA remaining was expressed relative to that in untreated controls. The amount of [3H]DNA remaining is also shown.
FIG. 4
FIG. 4
Protein complexes detected after cross-linking with formaldehyde. (A) Establishment of conditions for cross-linking. Cells were either untreated or treated with 1% formaldehyde for 1, 2, or 10 min and then with 0.1% formaldehyde for 3 min, extracted with 2 M NaCl, and centrifuged. Total (t) proteins in extracted cells and those in supernatant (s) and pellet (p) were resolved in a 15% gel and stained with Coomassie blue. After 0, 1, 2, and 10 min in 1% formaldehyde, 0, 65, 80, and 95%, respectively, of the histones were recovered in the pellet. (B) Proteins remaining after treatment of fixed cells with micrococcal nuclease (MNase). Cells were fixed with 1% formaldehyde for 2 min and then with 0.1% formaldehyde for 3 min, lysed with saponin, incubated with or without micrococcal nuclease ± CaCl2 at 37°C, chilled on ice, extracted with 2 M NaCl, and pelleted; then the proteins in the pellet were resolved on a gel, stained with Coomassie blue (top), or blotted and probed with antibodies directed against the proteins indicated. Selected regions of the blots are shown below. Lanes 1 to 4: 1/8×, 1/4×, 1/2×, and 1× loading of cells treated similarly but incubated on ice; lanes 5 to 9: samples incubated with 0, 0.0016, 0.008, 0.04, or 0.2 U of MNase per ml and 1 mM CaCl2; lane 10, sample incubated with 0.2 U of MNase per ml without CaCl2. (C) Photograph of DNA fragments from fixed cells treated with micrococcal nuclease. DNA fragments in samples 4 to 10 in panel B were run on an agarose gel and stained with ethidium. (D) Micrographs illustrating the distribution of Sp1 and Pol II. Cells on coverslips were fixed, treated with micrococcal nuclease or left untreated (as in panel B, lanes 4 and 9), extracted with 2 M NaCl, and refixed with 4% formaldehyde. Then Sp1 and the largest subunit of Pol II were indirectly immunolabelled with Cy3, nucleic acids were counterstained with SYTO16, and equatorial sections through cells were obtained under a confocal microscope. Both Sp1 and Pol II survive extraction with 2 M NaCl and are found in many small foci throughout the nucleoplasm but not in nucleoli (top row). After nuclease treatment, considerable amounts of nucleic acids and Sp1 are extracted, but most of the Pol II remains. Bar, 20 μm.
FIG. 5
FIG. 5
Protein complexes detected in glycerol gradients (A to E) and by immunoprecipitation (F). Extracts were prepared in different ways; in panels E and F, they were also dialyzed against a hypotonic buffer and clarified by centrifugation. For analysis in sucrose gradients (A to E), extracts were centrifuged, fractions were collected, and the protein contents of equal volumes of different fractions were determined by immunoblotting with antibodies directed against the various proteins indicated in the center. The content of 1/10 the input applied to the gradient is shown on the left of each blot. Arrows and brackets show positions of 40S and 60S ribosomal subunits and large complexes containing SRB7, respectively. For immunoprecipitation (F), undialyzed or dialyzed extracts were incubated with different antibodies bound to beads, the beads were pelleted, and the protein content in the pellet was determined by immunoblotting as above. (A) Whole-cell (Manley) extract. (B) Nuclear (Dignam) extract. (C) Saponin supernatant (Fig. 1, structure 2). A total of 3, 7, 2, <1, 20, 3, <1, 3, and 32% of Pol II, SRB7, TFIIB, TBP, TAF100, TFIIEα, RAP74, MAT1, and p89, respectively, were found in fractions 9 and 11. (D) Sonicated supernatant (Fig. 1, structure 8). (E) As in panel C but dialyzed against a hypotonic buffer and clarified by centrifugation. A total of 16, 7, 14, 3, 44, 20, 19, 3, and 55% of Pol II, SRB7, TFIIB, TBP, TAF100, TFIIEα, RAP74, MAT1, and p89, respectively, were found in fractions 9 and 11. (F) Proteins in undialyzed (−) and dialyzed (+) saponin extracts (as in panels C and E) were immunoprecipitated with a control mouse IgG (lanes 1 and 2) or an anti-Cdk7 antibody (lanes 3 and 4), and proteins in the pellet were detected by immunoblotting.
FIG. 6
FIG. 6
Models for the formation of the preinitiation complex. In all models, TBP (oval) is shown bound to the promoter, and transcription begins only once the complete complex has formed. (A) Individual components (squares) are added in a stepwise manner. (B) Individual components bind as a preformed holoenzyme. (C) A chromatin loop is shown attached to the underlying nuclear structure (thick grey line); the preinitiation complex is assembled progressively on the underlying structure by an initial attachment of the TBP-promoter complex and subsequent addition of individual components. (D) The TBP-promoter complex attaches to a preformed holoenzyme on the substructure.

Similar articles

Cited by

References

    1. Apone L M, Virbasius C M, Reese J C, Green M R. Yeast TAF(II)90 is required for cell-cycle progression through G2/M but not for general transcription activation. Genes Dev. 1996;10:2368–2380. - PubMed
    1. Barberis A, Pearlberg J, Simkovich N, Farrell S, Reinagel P, Bamdad C, Sigal G, Ptashne M. Contact with a component of the polymerase II holoenzyme suffices for gene activation. Cell. 1995;81:359–368. - PubMed
    1. Beebee T J C. A comparison of methods for extracting ribonucleic acid polymerases from rat liver nuclei. Biochem J. 1979;183:43–54. - PMC - PubMed
    1. Besse S, Vigneron M, Pichard E, Puvion-Dutilleul F. Synthesis and maturation of viral transcripts in herpes simplex virus type 1 infected HeLa cells: the role of interchromatin granules. Gene Expression. 1995;4:143–161. - PMC - PubMed
    1. Bregman D B, Du L, van der Zee S, Warren S L. Transcription-dependent redistribution of the large subunit of RNA polymerase II to discrete nuclear domains. J Cell Biol. 1995;129:287–298. - PMC - PubMed

Publication types

MeSH terms