. 1999 Aug;19(8):5429-40.
doi: 10.1128/MCB.19.8.5429.

Differentiation-induced internal translation of c-sis mRNA: analysis of the cis elements and their differentiation-linked binding to the hnRNP C protein

Affiliations

Differentiation-induced internal translation of c-sis mRNA: analysis of the cis elements and their differentiation-linked binding to the hnRNP C protein

O Sella et al. Mol Cell Biol. 1999 Aug.

Abstract

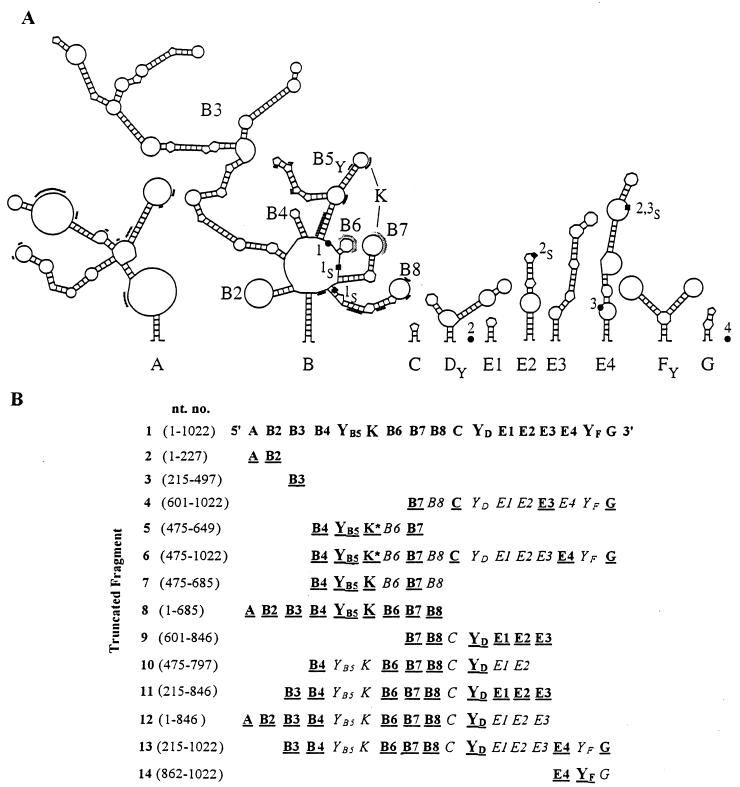
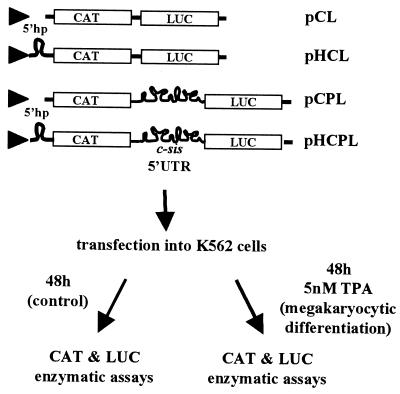
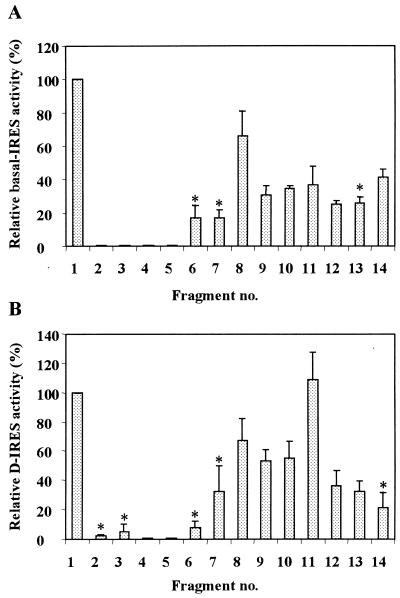
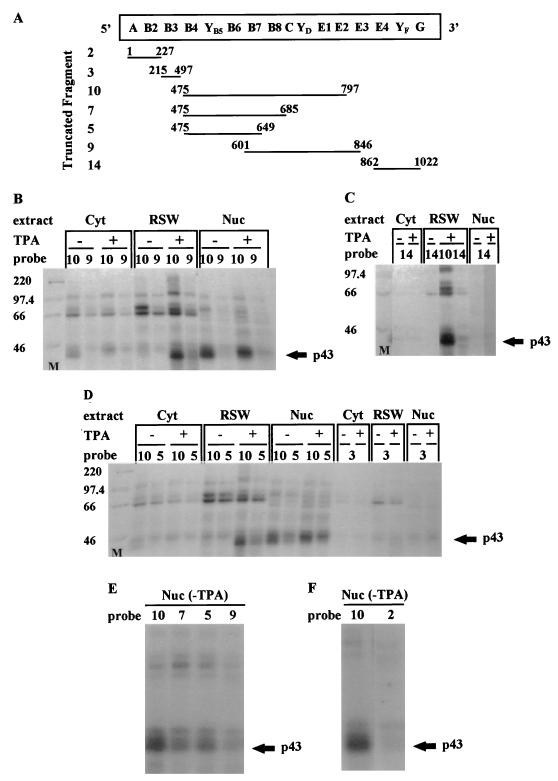
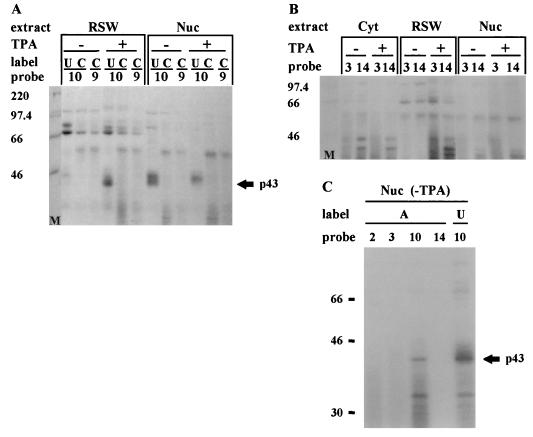
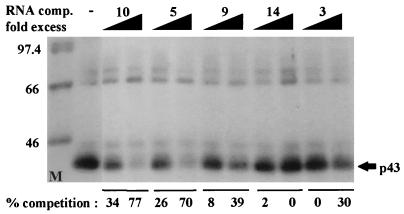
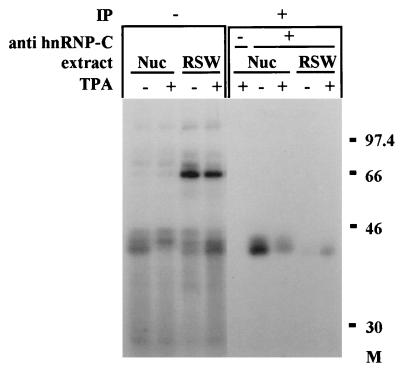
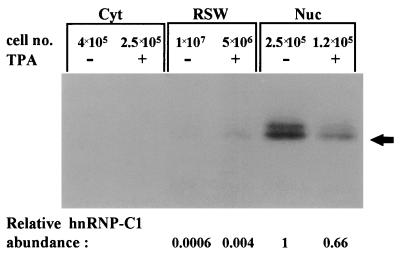
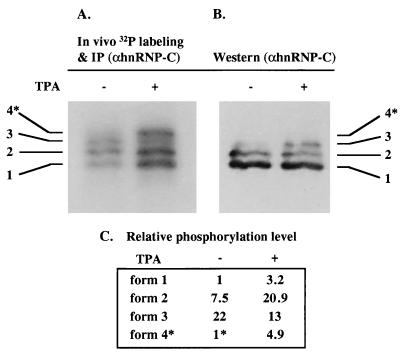
In previous reports we showed that the long 5' untranslated region (5' UTR) of c-sis, the gene encoding the B chain of platelet-derived growth factor, has translational modulating activity due to its differentiation-activated internal ribosomal entry site (D-IRES). Here we show that the 5' UTR contains three regions with a computer-predicted Y-shaped structure upstream of an AUG codon, each of which can confer some degree of internal translation by itself. In nondifferentiated cells, the entire 5' UTR is required for maximal basal IRES activity. The elements required for the differentiation-sensing ability (i.e., D-IRES) were mapped to a 630-nucleotide fragment within the central portion of the 5' UTR. Even though the region responsible for IRES activation is smaller, the full-length 5' UTR is capable of mediating the maximal translation efficiency in differentiated cells, since only the entire 5' UTR is able to confer the maximal basal IRES activity. Interestingly, a 43-kDa protein, identified as hnRNP C, binds in a differentiation-induced manner to the differentiation-sensing region. Using UV cross-linking experiments, we show that while hnRNP C is mainly a nuclear protein, its binding activity to the D-IRES is mostly nuclear in nondifferentiated cells, whereas in differentiated cells such binding activity is associated with the ribosomal fraction. Since the c-sis 5' UTR is a translational modulator in response to cellular changes, it seems that the large number of cross-talking structural entities and the interactions with regulated trans-acting factors are important for the strength of modulation in response to cellular changes. These characteristics may constitute the major difference between strong IRESs, such as those seen in some viruses, and IRESs that serve as translational modulators in response to developmental signals, such as that of c-sis.


Figures

FIG. 1
FIG. 1
(A) Updated structural model of the 5′ UTR of human c-sis. Based on the updated sequence, a conserved structure of the c-sis 5′ UTR was predicted by a combination of phylogenetic, thermodynamic, and statistical methods as described previously (4). RNA pseudoknot interaction is indicated by the letter K. The three upstream AUG codons are marked as 1●, 2●, and 3●, and their in-frame stop codons are marked as 1S■, 2S■, and 3S■. AUG4, the translation initiator codon, is positioned at nt 1023 to 1025 at the very 3′ end and is marked as 4●. U- and A-rich sequences are marked by additional light or heavy lines, respectively. (B) Schematic presentation of the truncated fragments. Nucleotide numbering refers to the 5′ and 3′ borders of each of the truncated fragments and corresponds to the human c-sis 5′ UTR. The folding of each fragment was analyzed as described in Materials and Methods. Evolutionarily conserved structures originally predicted in the full-length 5′ UTR that were robust in the context of the truncated background are boldfaced and underlined. The pseudoknot interaction is indicated by the letter K; an asterisk indicates that the pseudoknot is not the authentic one.
FIG. 2
FIG. 2
Schematic presentation of the experimental system. The bicistronic transcriptional unit expressing the E. coli CAT and firefly LUC reporter genes as the first and second cistrons, respectively, under the control of the CMV promoter (triangle) was used. The full-length or truncated c-sis 5′ UTR was placed in the intercistronic space of the bicistronic unit. Two versions of each plasmid were made, with and without a 5′hp upstream of the first cistron, as detailed previously (4). Plasmids lacking c-sis sequences, without or with the 5′hp, were termed pCL or pHCL, respectively, whereas plasmids containing the full-length c-sis 5′ UTR were termed pCPL or pHCPL. K562 cells were transfected with each of the recombinant plasmids, followed by a 48-h incubation in medium with or without TPA, as explained in Materials and Methods. CAT and LUC enzymatic activities were then determined.
FIG. 3
FIG. 3
(A) Each of the truncated 5′ UTR segments described in Fig. 1B was placed in the bicistronic expression unit between CAT and LUC. Both versions of each plasmid, with and without the 5′hp, were transfected into nondifferentiated K562 cells, followed by analysis of CAT and LUC activities. The basal IRES value represents the ratio between the 5′hp effect on LUC and the 5′hp effect on CAT, normalized to the ratio obtained from the empty vector. In each transfection experiment, the IRES value of each truncated fragment was compared to that of the full-length 5′ UTR (fragment 1), which was taken as 100%. Each IRES value is the average ± standard error (SE) from two to four independent experiments. The analysis of variance (ANOVA) procedure was used to verify the statistical significance of the results. Insignificant IRES values (P > 0.05) are marked by asterisks. (B) Each of the truncated bicistronic plasmids described in Fig. 1B without the 5′hp was transfected into K562 cells. After 48 h of incubation under control or differentiation conditions, CAT and LUC activities were determined. The D-IRES value represents the LUC/CAT ratio obtained in the differentiated cells relative to that in the control cells, normalized to the same ratio obtained from the empty vector (pCL). The D-IRES value of the full-length 5′ UTR (fragment 1) was taken as 100%. Each value is the average ± SE from two to four independent experiments. The ANOVA procedure was used to verify the statistical significance of the results. Insignificant D-IRES values (P > 0.05) are marked by asterisks.
FIG. 4
FIG. 4
UV cross-linking. (A) Schematic presentation of the predicted structural domains within the c-sis 5′ UTR. Truncated fragments as detailed in Fig. 1B, which were used as 32P-labeled probes for the UV-cross-linking experiments, are indicated. Nucleotide numbering refers to the 5′ and 3′ borders of each truncated fragment. (B through F) Cytoplasmic S100 (Cyt), RSW, and nuclear (Nuc) extracts were prepared from control (−TPA) or differentiated (+TPA) K562 cells. Twenty micrograms of protein was cross-linked to 5 fmol of a [32P]UTP-labeled RNA probe representing a truncated 5′ UTR fragment as listed in Fig. 4A. The proteins were separated on an SDS–10% PAGE gel. Molecular weight markers (M) are indicated at the left.
FIG. 5
FIG. 5
Twenty micrograms of protein of the cytoplasmic S100 (Cyt), RSW, and nuclear (Nuc) extracts from control (−TPA) or differentiated (+TPA) K562 cells were UV cross-linked to 5 fmol of RNA probes representing the truncated fragments listed in Fig. 4A. The probes were labeled with [32P]UTP or [32P]CTP (A), [32P]CTP (B), or [32P]UTP or [32P]ATP (C). The RNA-protein complexes were separated on an SDS–10% polyacrylamide gel. The molecular weights of the markers (in kilodaltons) are indicated at the left.
FIG. 6
FIG. 6
Five femtomoles of [32P]UTP-labeled RNA probe 10 and 5 μg of protein of RSW from differentiated cells were used for each UV-cross-linking reaction. A 10- or 50-fold molar excess of unlabeled RNA fragment 3, 5, 9, 10, or 14, as listed in Fig. 4A, was included as a cold competitor. Following SDS–10% PAGE and autoradiography, quantitative analysis of the relative p43 band intensity was performed with 1D image analysis software. The percent competition was defined by 100[1 − (x/y)], where x is the p43 signal obtained in each competition reaction and y is the maximum p43 signal obtained without competitors. The molecular weights of the markers (in kilodaltons) are indicated at the left.
FIG. 7
FIG. 7
Identification of hnRNP C determinants on p43. Eighty micrograms of protein of nuclear (Nuc) or RSW extracts from control (−TPA) or differentiated (+TPA) K562 cells were UV cross-linked to 9 fmol of [32P]UTP-labeled RNA probe 10, as detailed in Fig. 4. Following UV cross-linking, the samples were immunoprecipitated (IP) by using a monoclonal antibody against hnRNP C (4F4). In the control samples monoclonal antibody 4F4 was omitted (−). Samples before immunoprecipitation are also shown (−IP). The RNA-protein complexes were separated on an SDS–10% polyacrylamide gel.
FIG. 8
FIG. 8
Cellular distribution of hnRNP C proteins in control and differentiated K562 cells. Polyclonal antibodies against hnRNP C were used for the Western analysis of 30 μg of cytoplasmic (Cyt), 30 μg of RSW, and 10 μg of nuclear (Nuc) extracts of control (−TPA) and differentiated (+TPA) K562 cells. The number of cells represented in each lane is indicated. Quantitative analysis of the relative band intensities was performed with 1D image analysis software. The calculated relative hnRNP C1 abundance (per cell) is indicated in arbitrary units.
FIG. 9
FIG. 9
Differentiation-induced hyperphosphorylation of hnRNP C. Control and differentiated K562 cells (− and + TPA, respectively) were metabolically labeled with 32Pi, followed by immunoprecipitation using an antibody specific for hnRNP C, separation by SDS-PAGE, and blotting onto a nitrocellulose membrane. (A) The membrane was exposed to a phosphorimager for quantification of the phosphoproteins. (B) The same membrane was analyzed for hnRNP C total protein level by Western analysis. (C) The intensity of each band in panel A, as quantified by TINA software (Raytest), was compared to that of the corresponding band in panel B, as quantified by 1D image analysis software. The phosphorylation status per protein level of form 1 within the control cells was set at 1. Since the hyperphosphorylated form 4, marked by an asterisk, was not visualized by Western analysis, its 32P band intensity in panel A was compared to the total level of all hnRNP C forms in the corresponding lane in panel B. Thus, the phosphorylation status of form 4 in the control cells was represented as 1∗.

Similar articles

Cited by

References

    1. Akiri G, Nahari D, Finkelstein Y, Le S-Y, Elroy-Stein O, Levi B-Z. Regulation of vascular endothelial growth factor (VEGF) expression is mediated by internal initiation of translation and alternative initiation of transcription. Oncogene. 1998;17:227–237. - PubMed
    1. Belsham G J, Sonenberg N. RNA-protein interactions in the regulation of picornavirus RNA translation. Microbiol Rev. 1996;60:499–511. - PMC - PubMed
    1. Bernstein J, Shefler I, Elroy-Stein O. The translational repression mediated by the platelet-derived growth factor 2/c-sis mRNA leader is relieved during megakaryocytic differentiation. J Biol Chem. 1995;270:10559–10565. - PubMed
    1. Bernstein J, Sella O, Le S-Y, Elroy-Stein O. PDGF2/c-sis mRNA leader contains a differentiation-linked internal ribosomal entry site (D-IRES) J Biol Chem. 1997;272:9356–9362. - PubMed
    1. Biamonti G, Bassi M T, Cartegni L, Mechta F, Uuvoli M, Cobianchi F, Riva S. Human hnRNP protein A1 gene expression—structural and functional characterization of the promoter. J Mol Biol. 1993;230:77–89. - PubMed

Publication types

MeSH terms

Substances

LinkOut - more resources