. 1999 Aug;19(8):5631-41.
doi: 10.1128/MCB.19.8.5631.

Flanking regulatory sequences of the Tetrahymena R deletion element determine the boundaries of DNA rearrangement

Affiliations

Flanking regulatory sequences of the Tetrahymena R deletion element determine the boundaries of DNA rearrangement

D L Chalker et al. Mol Cell Biol. 1999 Aug.

Abstract

In the ciliate Tetrahymena thermophila, thousands of DNA segments of variable size are eliminated from the developing somatic macronucleus by specific DNA rearrangements. It is unclear whether rearrangement of the many different DNA elements occurs via a single mechanism or via multiple rearrangement systems. In this study, we characterized in vivo cis-acting sequences required for the rearrangement of the 1.1-kbp R deletion element. We found that rearrangement requires specific sequences flanking each side of the deletion element. The required sequences on the left side appear to span roughly a 70-bp region that is located at least 30 bp from the rearrangement boundary. When we moved the location of the left cis-acting sequences closer to the eliminated region, we observed a rightward shift of the rearrangement boundary such that the newly formed deletion junction retained its original distance from this flanking region. Likewise, when we moved the flanking region as much as 500 bp away from the deletion element, the rearrangement boundary shifted to remain in relative juxtaposition. Clusters of base substitutions made throughout this critical flanking region did not affect rearrangement efficiency or accuracy, which suggests a complex nature for this regulatory sequence. We also found that the right flanking region effectively replaced the essential sequences identified on the left side, and thus, the two flanking regions contain sequences of analogous function despite the lack of obvious sequence identity. These data taken together indicate that the R-element flanking regions contain sequences that position the rearrangement boundaries from a short distance away. Previously, a 10-bp polypurine tract flanking the M-deletion element was demonstrated to act from a distance to determine its rearrangement boundaries. No apparent sequence similarity exists between the M and R elements. The functional similarity between these different cis-acting sequences of the two elements is firm support for a common mechanism controlling Tetrahymena rearrangement.


Figures

FIG. 1
FIG. 1
The R element and the rearrangement assay. (A) Schematic diagram of the R element. The bar above the diagram indicates the region of the element originally sequenced by Austerberry and Yao (4) and is divided into 200-bp increments. We have separated the element into three parts and assigned a numbering system to each. The micronucleus-limited region that is eliminated during rearrangement is shown as a narrow, solid box and is numbered left to right from +1 to +1084. Positions +1 and +1084 correspond to nucleotides 329 and 1413 as assigned in the original published sequence. The macronucleus-destined region on the left is represented as the wide, open box and numbered right to left from −1L to −328L. The right macronucleus-destined region is shown as the wide, shaded box and is numbered left to right from −1r to −421r. For positions beyond −328L and −421r, the distances are approximate. Positions of the predominant left and right rearrangement boundaries formed by elimination of the endogenous R element are designated by the open and shaded arrowheads, respectively. The nucleotide positions, 328 and 1414, joined by rearrangement are given under these arrowheads and correspond to the first nucleotides of the left (−1L) and right (−1r) flanking regions. (B) The rearrangement activity of vector-borne deletion elements are tested by transformation of conjugating Tetrahymena cells. Conjugation is initiated by mixing prestarved strains CU427 and CU428. Approximately 8 to 9 h after mixing, the transformation vectors are introduced into the developing macronuclei by microinjection or electroporation. The transformants are identified by their growth in the presence of the antibiotic paromomycin. DNA is isolated from the transformants, digested with restriction endonucleases to liberate the DNA fragment containing the deletion element from the transforming rDNA molecules, and analyzed by gel electrophoresis and Southern blot hybridization.
FIG. 2
FIG. 2
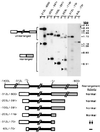
Analysis of external deletion of sequences flanking the micronucleus-limited region. Plasmid constructs containing progressively larger deletions of sequences flanking the R element were assayed for the ability to undergo precise deletion upon transformation. Plasmid DNA (P) and DNA isolated from transformants (T) were digested with NotI prior to electrophoresis and transfer to nitrocellulose membranes. Southern blot hybridization analysis with a probe specific to the macronuclear DNA from −312L to ∼−900r of the R element is shown at the top. A longer exposure of the right-hand lanes is shown to allow visualization of less abundant fragments. Positions of the unrearranged and rearranged elements are indicated to the left; positions of PstI-digested lambda DNA size standards are shown to the right. PhosphorImager analysis was used to quantify hybridization. To determine whether rearrangement was accurate, filters were hybridized separately with an end-labeled oligonucleotide, J1110R, that detects specifically the predominant rearrangement junction of chromosomal R elements. These hybridizing fragments are indicated by the arrowheads. The major rearranged product for the −203L/−116r is ∼200 bp larger than the accurately rearranged species and is denoted by the asterisk. The amount of DNA flanking the R element in each construct is indicated above each set of lanes. A diagram of the constructs is given at the bottom. The solid box represents the micronucleus-limited sequences; the wider open and shaded boxes represent the left and right macronucleus-destined regions, respectively. The rearrangement activity (ratio of hybridization to rearranged forms and the unrearranged construct) relative to an intact R element is shown on the bottom right: Normal, normal activity (>50%); ↓, reduced activity (11 to 49%); ↓ ↓, greatly reduced activity (<10%); and −, no detectable rearrangement.
FIG. 3
FIG. 3
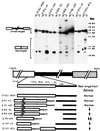
Analysis of small sequence deletions at the left flank of the R element. R-element constructs containing small <105-bp deletions at the left boundary of the micronucleus-limited region were transformed into conjugating Tetrahymena cells. Southern blot hybridization analysis used to assess the rearrangement of various R-element constructs is shown at the top. Plasmid DNA (P) and DNA isolated from transformants (T) were digested with AccI and NotI (−312L/−900r, Δ−31L:+3, Δ−31L::+24, Δ−62L:−1L, and Δ−62L:+24) or NotI alone (Δ−76L::+24, Δ−101L:+3, and Δ−101L:−61L) prior to electrophoresis and transfer to nitrocellulose membranes. The probes were the same as used for Fig. 2. A longer exposure for some lanes is given to allow visualization of DNA fragments in low abundance. Positions of PstI-digested lambda DNA size standards are shown to the right. Arrowheads indicate the fragments that hybridized to the oligonucleotide probe that detects the major chromosomal junction sequence. The region deleted from each construct is indicated above each set of lanes. A diagram showing an enlargement of the left flanking region of each construct is given at the bottom. Nucleotide positions of the deletion endpoints are indicated above the enlargement. The 6-bp ApaI site, GGGCCC, was inserted in place of the sequences removed. The efficiency of rearrangement relative to the activity of an intact R element is given to the right of each diagram: Normal, normal activity; ↓, reduced activity; and ↓ ↓, greatly reduced activity.
FIG. 4
FIG. 4
The left rearrangement boundary shifts rightward into the micronucleus-limited region a distance corresponding to the length of sequence removed from the left flanking DNA. The R element including an enlargement of the left end is shown schematically at the top. The narrow and wide boxes represent the micronucleus-limited and macronucleus-destined flanking regions, respectively, and are shaded as in prior figures. The name of each construct is indicated at the left edge of each schematic. Shaded arrowheads indicate positions of the right rearrangement boundaries; open arrowheads indicate positions of the left rearrangement boundaries. Each bar represents an independently rearranged element with its left boundary observed to be at the position indicated by the associated arrowhead. The number above each arrowhead denotes the position of the boundary relative to the start of the micronucleus-limited region as described in Fig. 1.
FIG. 5
FIG. 5
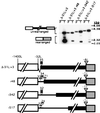
The rearrangement boundary and the flanking region remain in relative juxtaposition in constructs containing sequence insertions at their left ends. DNA fragments of 48, 342, and 517 bp were inserted into the ApaI site of deletion construct Δ−31L:+3, and the rearrangement of each construct was determined by Southern blot hybridization of NotI-digested plasmid (P) or transformant (T) DNA. The probes were the same as used for Fig. 2. The positions of HindIII-digested lambda DNA size standards are shown to the right. A diagram of the constructs is given at the bottom. The solid boxes represent the micronucleus-limited sequence; the wider open and shaded boxes represent the macronucleus-destined flanking regions; the wide lines represent the inserted sequence. Positions of the rearrangement boundaries on the right are indicated by the shaded arrowheads and were found to be at the same position, −1r or −4r, for each junction analyzed for a given construct. Each shaded arrowhead indicates the position of the left rearrangement boundary; each bar represents an independently rearranged element with its left boundary observed to be at the position indicated by the associated arrowhead. The nucleotide positions given above each arrowhead denote the observed distance of each left boundary from the −32L position. Eleven of twelve left side boundaries are within a 14-bp region right of this position.
FIG. 6
FIG. 6
Clustered mutations in the left flanking region have little effect on rearrangement efficiency or accuracy. Each R-element construct contains five or six changes within 10-bp blocks of the left flanking region between −32L and −95L. Southern blot hybridization analysis of two pools, A and B, each containing DNA from >10 transformants was used to assess the ability of each construct to undergo accurate rearrangement. The plasmids, RPM1 to RPM5, used for transformation are indicated above the pair of lanes. DNA was digested with BamHI prior to electrophoresis and transfer to a nitrocellulose membrane. Lane P is plasmid RPM1 digested with BamHI. The positions of PstI-digested lambda DNA size standards are shown to the right. A diagram of the R element and an enlargement of the left flanking sequence between −30L and −100L are shown at the bottom. The clusters of mutations that create each construct, boxed and labeled with their corresponding construct names, are shown in bold beneath this sequence.
FIG. 7
FIG. 7
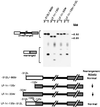
The right flanking sequence effectively substitutes for the essential left flanking region. R-element constructs containing substitutions of the sequence immediately flanking the left end of the micronucleus-limited region with sequence flanking the right end were transformed into conjugating Tetrahymena cells. Southern blot hybridization analysis used to assess the rearrangement of each construct is shown at the top. Plasmid DNA (P) and DNA isolated from transformants (T) was digested with BamHI prior to electrophoresis and transfer to the nitrocellulose membrane. The positions of HindIII-digested lambda DNA size standards are shown to the right. The sequences flanking the left end of the eliminated region are indicated above each set of lanes. A diagram of the flank substitution constructs is shown at the bottom. In each schematic, the narrow black box represents the micronucleus-limited sequences. The wide white and shaded boxes represent the sequences flanking the eliminated region to the left and right, respectively.

Similar articles

Cited by

References

    1. Altschuler M I, Yao M C. Macronuclear DNA of Tetrahymena thermophila exists as defined subchromosomal-sized molecules. Nucleic Acids Res. 1985;13:5817–5831. - PMC - PubMed
    1. Austerberry C F, Allis C D, Yao M C. Specific DNA rearrangements in synchronously developing nuclei of Tetrahymena. Proc Natl Acad Sci USA. 1984;81:7383–7387. - PMC - PubMed
    1. Austerberry C F, Snyder R O, Yao M C. Sequence microheterogeneity is generated at junctions of programmed DNA deletions in Tetrahymena thermophila. Nucleic Acids Res. 1989;17:7263–7272. - PMC - PubMed
    1. Austerberry C F, Yao M C. Nucleotide sequence structure and consistency of a developmentally regulated DNA deletion in Tetrahymena thermophila. Mol Cell Biol. 1987;7:435–443. - PMC - PubMed
    1. Austerberry C F, Yao M C. Sequence structures of two developmentally regulated, alternative DNA deletion junctions in Tetrahymena thermophila. Mol Cell Biol. 1988;8:3947–3950. - PMC - PubMed

Publication types

LinkOut - more resources