Comparative Study
. 1999 Aug;19(8):5685-95.
doi: 10.1128/MCB.19.8.5685.

Activity of the c-myc replicator at an ectopic chromosomal location

Affiliations
Comparative Study

Activity of the c-myc replicator at an ectopic chromosomal location

M Malott et al. Mol Cell Biol. 1999 Aug.

Erratum in

  • Mol Cell Biol 1999 Dec;19(12):8694

Abstract

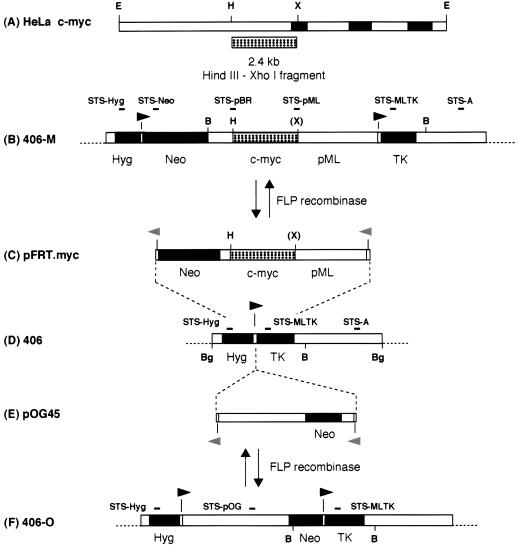
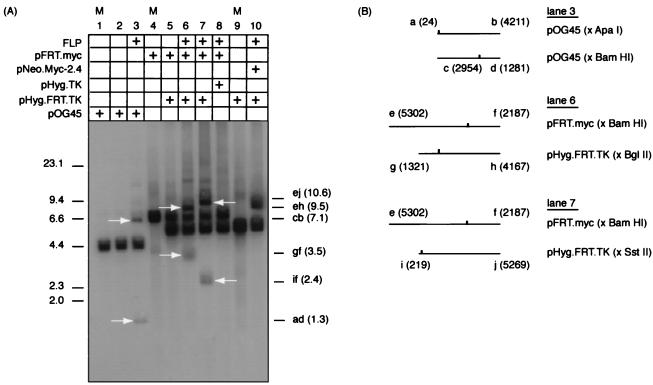
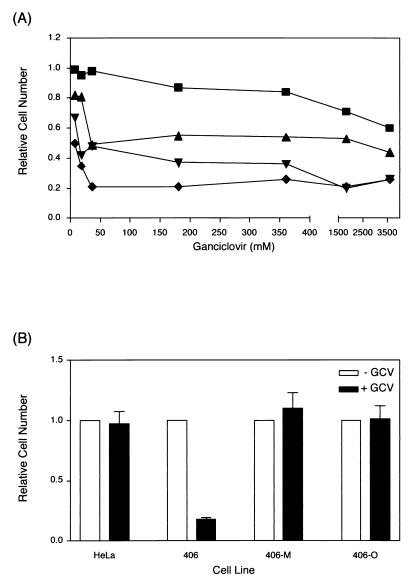
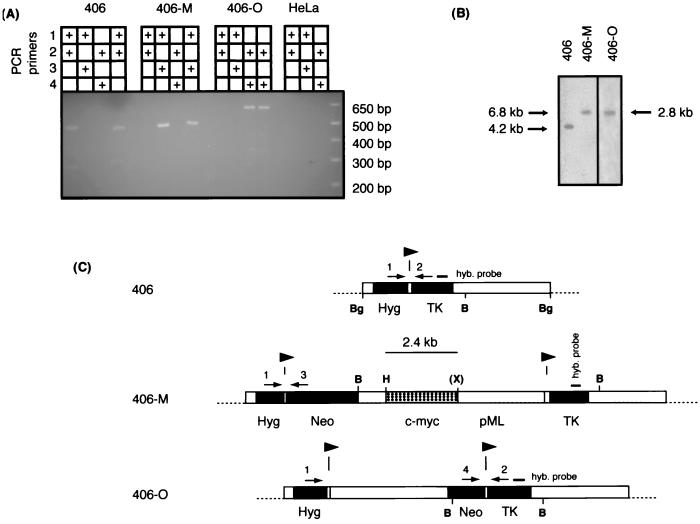
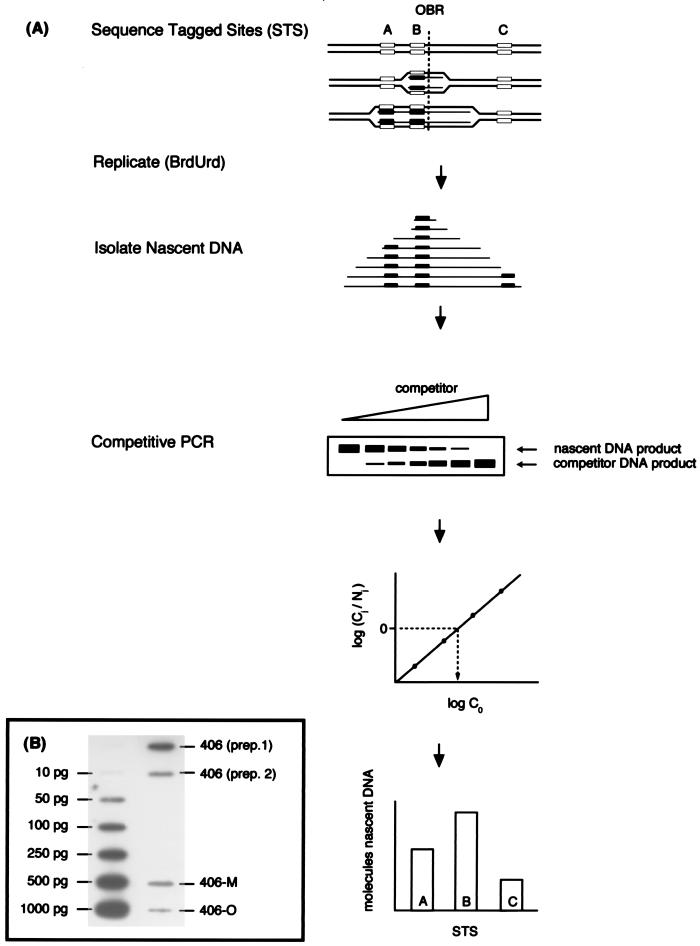
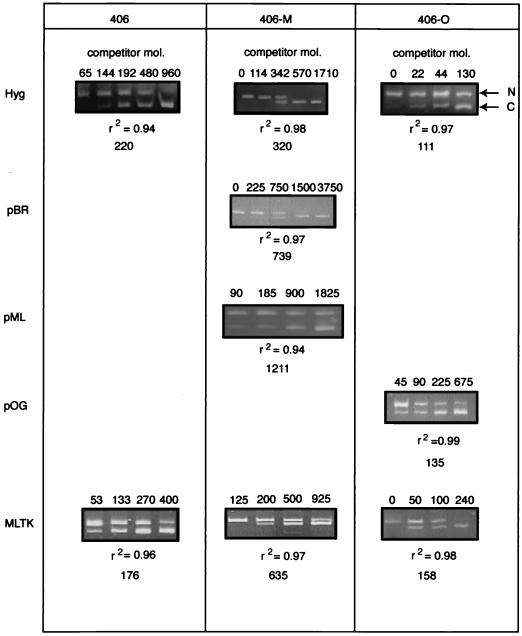
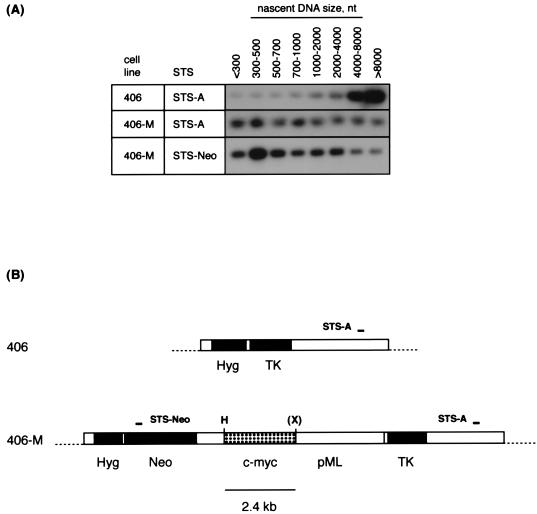
DNA replication starts at multiple discrete sites across the human chromosomal c-myc region, including two or more sites within 2.4 kb upstream of the c-myc gene. The corresponding 2.4-kb c-myc origin fragment confers autonomously replicating sequence (ARS) activity on plasmids, which specifically initiate replication in the origin fragment in vitro and in vivo. To test whether the region that displays plasmid replicator activity also acts as a chromosomal replicator, HeLa cell sublines that each contain a single copy of the Saccharomyces cerevisiae FLP recombinase target (FRT) sequence flanked by selectable markers were constructed. A clonal line containing a single unrearranged copy of the transduced c-myc origin was produced by cotransfecting a donor plasmid containing the 2.4-kb c-myc origin fragment and FRT, along with a plasmid expressing the yeast FLP recombinase, into cells containing a chromosomal FRT acceptor site. The amount of short nascent DNA strands at the chromosomal acceptor site was quantitated before and after targeted integration of the origin fragment. Competitive PCR quantitation showed that the c-myc origin construct substantially increased the amount of nascent DNA relative to that at the unoccupied acceptor site and to that after the insertion of non-myc DNA. The abundance of nascent strands was greatest close to the c-myc insert of the integrated donor plasmid, and significant increases in nascent strand abundance were observed at sites flanking the insertion. These results provide biochemical and genetic evidence for the existence of chromosomal replicators in metazoan cells and are consistent with the presence of chromosomal replicator activity in the 2.4-kb region of c-myc origin DNA.


Figures

FIG. 1
FIG. 1
DNA maps. (A) HeLa endogenous c-myc locus. Solid boxes, exons; open boxes, introns or flanking DNA; stippled box, the 2.4-kb c-myc HindIII-XhoI origin fragment. (B) Acceptor site in 406-M cells after FLP-mediated recombination of pFRT.Myc into the chromosomal FRT of 406 cells. Solid arrowheads indicate locations and polarity of FRT sites. Hyg, hygromycin resistance gene; Neo, neomycin (G418) resistance gene; pML and open boxes, vector sequences; TK, HSV TK gene. (C) The FRT donor construct pFRT.Myc (shown linearized at the FRT XbaI site). c-myc, 2.4-kb HindIII-XhoI c-myc origin fragment; Neo, promoterless neomycin phosphotransferase gene. Dashed lines indicate FLP-mediated integration of the donor construct pFRT.Myc at the pHyg.FRT.TK chromosomal acceptor locus in 406 cells. Shaded (left-pointing) arrowheads indicate locations and polarity of FRT half-sites. (D) Chromosomal acceptor site in 406 cells after the introduction of the FRT construct pHyg.FRT.TK. (Note that the DNA is shown linearized at the BglI site, although the exact ends of the integrated construct have not been mapped.) (E) Control non-myc DNA FRT donor construct (shown linearized at the FRT XbaI site). Note that the Neo cassette is a different size in pOG45 than in pFRT.Myc. (F) Acceptor site in 406-O cells after FLP-mediated recombination of pOG45 into the chromosomal FRT of 406 cells. B, BamHI; Bg, BglII; E, EcoRI; H, HindIII; X, XhoI; (X), XhoI site destroyed in cloning. STSs used in the experiments of Fig. 6 and 8 are indicated above the maps.
FIG. 2
FIG. 2
In vitro FLP recombinase reactions. (A) Acceptor and donor plasmid constructs, with or without an FRT, were linearized and incubated in the presence or absence of purified FLP recombinase. Lanes marked M are size markers generated from control DNA. Lanes 1 and 2, pOG45 linearized with ApaI. No chimeric products are detectable. Lane 3, a mixture of pOG45 linearized with ApaI or BamHI. Lane 4, pFRT.Myc (cut with BamHI). Lanes 5 and 6, pFRT.Myc (BamHI cut) and pHyg.FRT.TK (BglII cut). Lane 7, pFRT.Myc (BamHI cut) and pHyg.FRT.TK (SstII cut). Lane 8, pFRT.Myc (BamHI cut) and pHyg.TK (BglII cut). Lane 9, pHyg.FRT.TK (SstII cut). Lane 10, pNeo.Myc-2.4 (BamHI cut) and pHyg.FRT.TK (HindIII cut). The products were resolved by gel electrophoresis and identified by hybridization to a probe with sequences common to all of the constructs. Chimeric fragments produced by recombination were of the expected sizes and are indicated by arrows. (B) Maps of FRT plasmid digests used in panel A. FRT position is indicated by an upward tick mark.
FIG. 3
FIG. 3
Ganciclovir sensitivity determined by MTT assay. (A) HeLa cells transfected with the linearized acceptor construct pHyg.FRT.TK and selected at different concentrations of hygromycin were exposed to increasing amounts of ganciclovir. The number of cells surviving drug selection after 7 days is expressed as a fraction of the number of untransfected HeLa cells surviving drug selection after the same period of time. ■, untransfected HeLa cells; ▴, 100 μg of hygromycin/ml; ▾, 200 μg of hygromycin/ml; ⧫, 400 μg of hygromycin/ml. (B) Ganciclovir resistance was measured before and after FRT-mediated integration of donor constructs. HeLa, untransfected HeLa cells; 406, chromosomal FRT acceptor cell line; 406-M, 406 cells with pFRT.Myc integrated at the chromosomal FRT; 406-O, 406 cells with pOG45 integrated at the 406 chromosomal FRT. Cells were grown in the absence (− GCV) or presence (+ GCV) of 15 μM ganciclovir for 7 days. The number of cells surviving drug selection is expressed as the fraction of the number of cells present without drug selection after the same period (plus the standard error of the mean).
FIG. 4
FIG. 4
Site-specific recombination in vivo. (A) Genomic DNA was isolated from the cell lines indicated and used in PCR amplifications with primers 1 through 4 as shown. HeLa DNA was used as a control for nonspecific amplification. The last lane for each cell line is an amplification of control DNA to produce PCR products specific for accurate FLP recombination. (B) Genomic DNA was isolated from 406, 406-M, and 406-O cells and digested with BamHI. Cells containing a single, unrearranged copy of the acceptor construct (406) and those that had integrated either the pFRT.Myc or the pOG45 donor plasmid specifically at the chromosomal FRT locus were identified by using a probe that was complementary to sequences common to all three cell lines. (C) Maps of the chromosomal acceptor sites in the 406, 406-M, and 406-O cell lines. Primer oligonucleotides 1 through 4 and their positions in acceptor (406), pFRT.Myc-integrated (406-M), and pOG45-integrated (406-O) cells are indicated above the linear maps by arrows. Primers 1 and 2 are specific to sequences found only in the acceptor construct, while primers 3 and 4 are complementary to Neo sequences found in both the pFRT.Myc and pOG45 donor constructs. Probes used in the Southern hybridization analysis are indicated above the maps. Symbols and abbreviations are as defined for Fig. 1.
FIG. 5
FIG. 5
Competitive PCR assay of nascent DNA abundance. (A) Unsynchronized cells were pulse labeled with BrdUrd to allow the synthesis of dense nascent fragments of various lengths. Isolated nascent DNA of 0.85 to 1.5 kb was quantitated at STS-A, -B, and -C by coamplification against known amounts of competitor template specific for each STS. Competitor templates were designed to be ca. 20 bp smaller so that the competitor and nascent PCR products were resolvable by polyacrylamide gel electrophoresis. The logarithm of the relative intensities of the nascent (Nj) and competitor (Cj) products produced in each reaction was plotted against the logarithm of the amount of competitor added (C0). The initial quantity of nascent DNA for each STS was determined by the amount of competitor template required to produce equal amounts of competitor and nascent products after amplification. The STS where the abundance of nascent DNA was greatest would be located closest to a replication origin. (B) Representative slot blot autoradiogram of filter used for PhosphorImager quantitation of nascent DNA, by interpolation on a straight-line plot (r2 > 0.99) of DNA amount (10 to 1,000 pg) versus PhosphorImager signal intensity.
FIG. 6
FIG. 6
Competitive PCR analysis of 406, 406-M, and 406-O nascent DNA. Representative gels of competitive PCRs with nascent DNA from the 406, 406-M, and 406-O cell lines are shown for the following STSs: Hyg, pBR, pML, pOG, and MLTK. pBR and pML are specific for the integrated pFRT.Myc sequences, while pOG is specific for the pOG45 sequences. Arrows indicate the positions of the nascent (N) and competitor (C) PCR products. The number of competitor molecules (mol.) added to each reaction is indicated at the top of each lane. The number of nascent molecules, calculated from a plot of the logarithm of the signal ratio versus the logarithm of the amount of competitor added, and the r2 value are shown below each gel.
FIG. 7
FIG. 7
Nascent DNA abundance at the chromosomal acceptor site. (A) The relative quantity of nascent strands as determined by competitive PCR is shown at each STS assayed in 406, 406-M, and 406-O cells. The data are means (plus standard deviations) of at least four to six different competitive PCR titrations of two or three independent nascent DNA preparations for each cell line. To allow comparison between cell lines, the quantities shown have been normalized to adjust for the different amounts of nascent DNA in each preparation (based on PhosphorImager quantitation) and are expressed relative to the abundance of nascent strands at STS-Hyg in 406 cells (defined as 1.0). (B) Acceptor site maps. Symbols and abbreviations are as defined for Fig. 1.
FIG. 8
FIG. 8
PCR mapping of nascent DNA near the FRT acceptor site. (A) Nascent DNA was isolated from 406 and 406-M cells and size fractionated by alkaline gel electrophoresis. A 5% aliquot of each size fraction was subjected to PCR in the linear range of amplification as described previously (39). Products were detected after gel electrophoresis by hybridization to probes specific to the internal regions of the products. Indicated above the lanes are the approximate sizes of the nascent DNA in each fraction. Note that the STS-Neo and STS-A PCR products are ∼230 bp and would not amplify smaller Okazaki fragments. (B) Acceptor site maps showing the locations of STS-A and STS-Neo. Symbols and abbreviations are as defined for Fig. 1.

Similar articles

Cited by

References

    1. Aladjem M I, Rodewald L W, Kolman J L, Wahl G M. Genetic dissection of a mammalian replicator in the human beta-globin locus. Science. 1998;281:1005–1009. - PubMed
    1. Benard M, Lagnel C, Pierron G. Site-specific initiation of DNA replication within the non-transcribed spacer of Physarum rDNA. Nucleic Acids Res. 1995;23:1447–1453. - PMC - PubMed
    1. Berberich S, Trivedi A, Daniel D C, Johnson E M, Leffak M. In vitro replication of plasmids containing human c-myc DNA. J Mol Biol. 1995;245:92–109. - PubMed
    1. Bielinsky A K, Gerbi S A. Discrete start sites for DNA synthesis in the yeast ARS1 origin. Science. 1998;279:95–98. - PubMed
    1. Connolly A R, Cleland L G, Kirkham B W. Mathematical considerations of competitive polymerase chain reaction. J Immunol Methods. 1995;187:201–211. - PubMed

Publication types

LinkOut - more resources