. 1999 Jul 20;96(15):8396-401.
doi: 10.1073/pnas.96.15.8396.

Crystal structure of ERA: a GTPase-dependent cell cycle regulator containing an RNA binding motif

Affiliations

Crystal structure of ERA: a GTPase-dependent cell cycle regulator containing an RNA binding motif

X Chen et al. Proc Natl Acad Sci U S A. .

Abstract

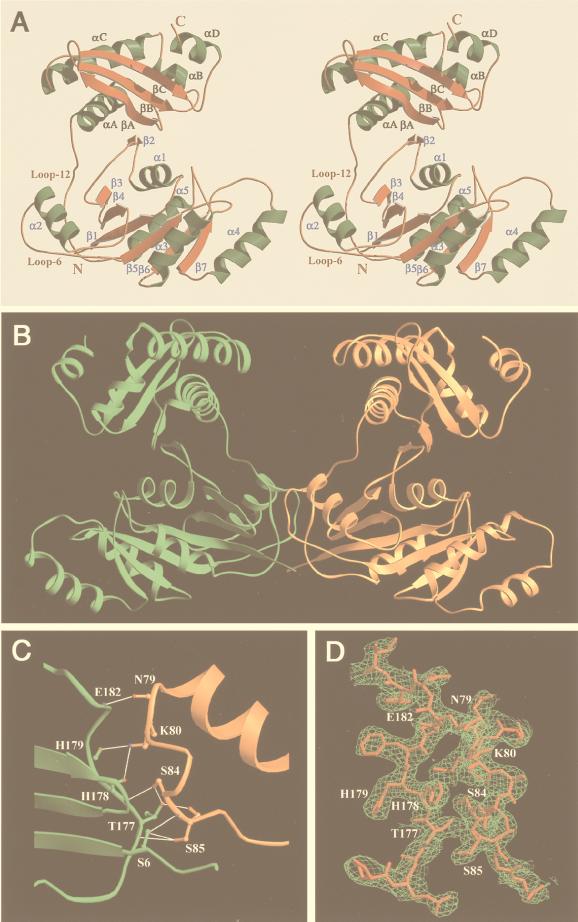
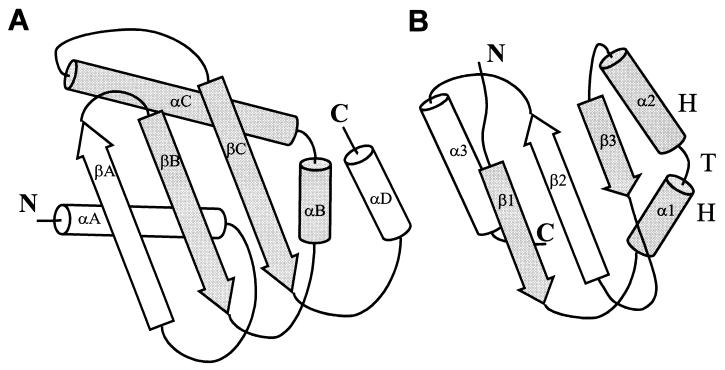
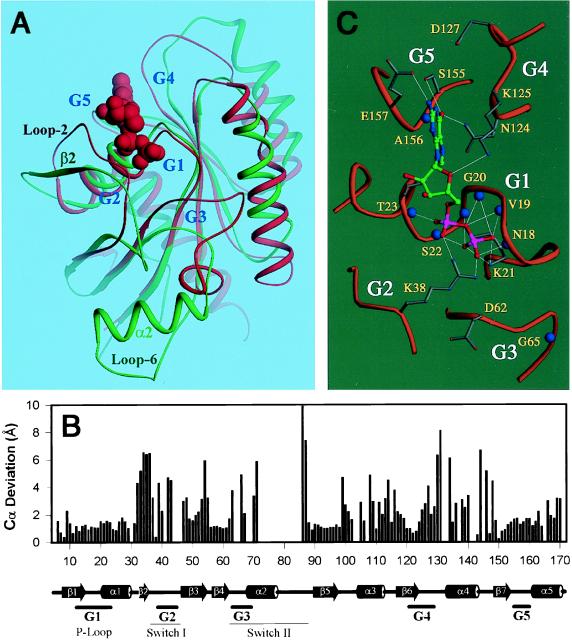
ERA forms a unique family of GTPase. It is widely conserved and essential in bacteria. ERA functions in cell cycle control by coupling cell division with growth rate. ERA homologues also are found in eukaryotes. Here we report the crystal structure of ERA from Escherichia coli. The structure has been determined at 2.4-A resolution. It reveals a two-domain arrangement of the molecule: an N-terminal domain that resembles p21 Ras and a C-terminal domain that is unique. Structure-based topological search of the C domain fails to reveal any meaningful match, although sequence analysis suggests that it contains a KH domain. KH domains are RNA binding motifs that usually occur in tandem repeats and exhibit low sequence similarity except for the well-conserved segment VIGxxGxxIK. We have identified a betaalphaalphabeta fold that contains the VIGxxGxxIK sequence and is shared by the C domain of ERA and the KH domain. We propose that this betaalphaalphabeta fold is the RNA binding motif, the minimum structural requirement for RNA binding. ERA dimerizes in crystal. The dimer formation involves a significantly distorted switch II region, which may shed light on how ERA protein regulates downstream events.


Figures

Figure 1
Figure 1
Overall structure of ERA. (A) Stereoview of the ERA monomer. (B) The ERA dimer in the crystal. A pseudo 2-fold axis is in the dimer interface. Half of the dimer interface is shown in C; the other half is not shown for clarity. The interactions consist of one backbone-to-backbone, six backbone-to-side chain, and two side chain-to-side chain hydrogen bonds (illustrated as thin white lines). (D) Characteristic electron density of MIR phasing is superimposed on final structure. The electron density from MAD phasing has comparable quality. A and D were prepared by using molscript (47) and raster3d (48), and B and C were prepared by using ribbons (49).
Figure 2
Figure 2
Topological diagrams showing the similarities and differences between (A) the C-terminal domain of ERA (this work) and (B) the KH domain of FMR1, the protein responsible for the fragile X syndrome (37). Although in general the two domains are topologically different, they share a βααβ fold (highlighted), of which the two central helices (αB and αC in ERA, α1 and α2 in FMR1) form a HTH structure with a sharp turn containing a sequence segment VIGxxGxxIK that is highly conserved among RNA binding KH domains.
Figure 3
Figure 3
Comparion of the ERA GTPase domain with H-Ras⋅GDP complex (9). (A) Superposition of the GTPase domain of ERA (in green) and the H-Ras⋅GDP complex (in red). GDP is shown as space-filling model. The G regions for nucleotide binding and the switch regions are labeled, as are the β2-strand, α2-helix, and loop 6 of the switch II region in ERA and loop 2 in H-Ras. (B) Cα deviations between ERA and Ras from the alignment in A. Empty space in the histogram indicates the loss of register between corresponding Cα atoms. Secondary structure assignment of ERA is indicated at the bottom. (C) A GDP molecule is modeled into the nucleotide binding pocket of ERA based on the superposition in A followed by a preliminary energy minimization (see text). The GDP molecule is shown in ball-and-stick model with atom-specific colors (carbon in green, oxygen in red, nitrogen in blue and phosphorus in magenta). Hydrogen bonds are illustrated as thin white lines and backbone amide nitrogen atoms as large blue spheres. The G1–G5 regions involved in nucleotide binding are labeled. A and C were prepared by using ribbons (49).

References

    1. March P E, Lerner C G, Ahnn J, Cui X, Inouye M. Oncogene. 1988;2:539–544. - PubMed
    1. Inada T, Kawakami K, Chen S M, Takiff H E, Court D L, Nakamura Y. J Bacteriol. 1989;171:5017–5024. - PMC - PubMed
    1. Zuber M, Hoover T A, Dertzbaugh M T, Court D L. Gene. 1997;189:31–34. - PubMed
    1. Zuber M, Hoover T A, Powell B S, Court D L. Mol Microbiol. 1994;14:291–300. - PubMed
    1. Britton R A, Powell B S, Dasgupta S, Sun Q, Margolin W, Lupski J R, Court D L. Mol Microbiol. 1998;27:739–750. - PubMed

Publication types

Associated data

LinkOut - more resources