

Mapping the sensitivity of T cells with an optical trap: polarity and minimal number of receptors for Ca(2+) signaling
- PMID: 10411899
- PMCID: PMC17540
- DOI: 10.1073/pnas.96.15.8471
Mapping the sensitivity of T cells with an optical trap: polarity and minimal number of receptors for Ca(2+) signaling
Abstract
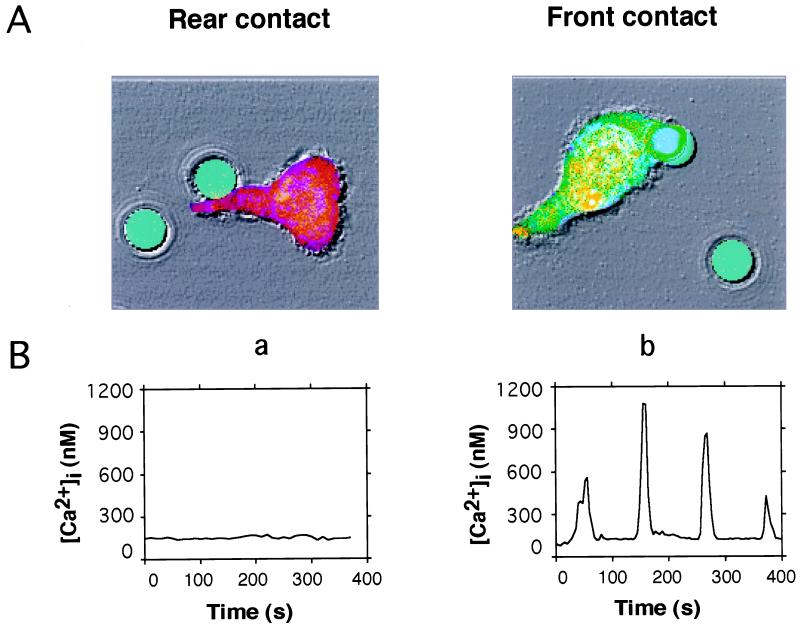
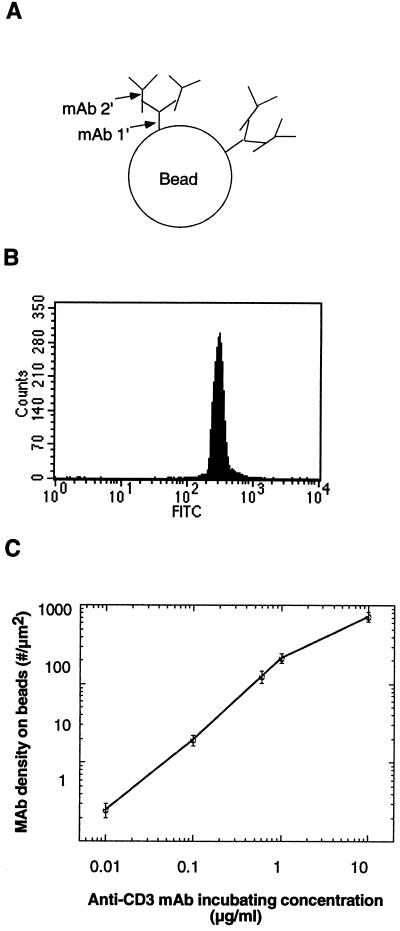
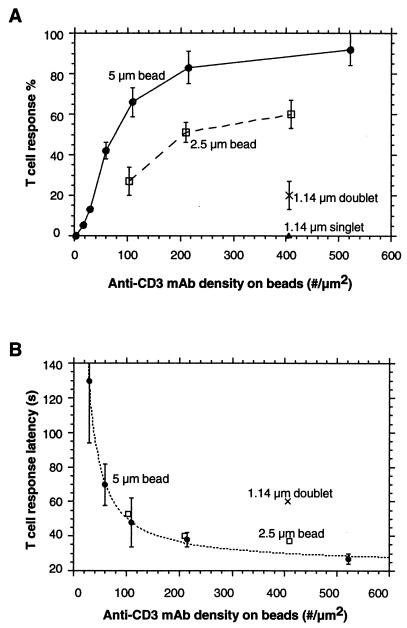
Contact with antigen-presenting cells (APCs) initiates an activation cascade within T lymphocytes, including a rise in cytosolic calcium, lymphokine production, and cell division. Although T cell-APC physical contact is required for an immune response, little is known about the patterns of cellular interactions and their relation to activation. Calcium imaging combined with an optical trap enabled the T cell contact requirements and polarity to be investigated at the single-cell level. APCs or anti-CD3 mAb-coated beads were trapped with a laser and placed at different locations along the T cell, which has a polarized appearance defined by the shape and direction of crawling. T cells were 3-fold more sensitive to APC contact made at the leading edge of the T cell than with contact made at the tail. Anti-CD3 mAb-coated 6-micrometer beads induced calcium signaling with approximately 10-fold higher frequency and approximately 4-fold shorter latency on contact with the leading edge of the T cell than on contact with the trailing edge. Alterations in antibody density (2 to 500 per micrometer(2)) and bead size (1 to 6 micrometer in diameter) were used to determine the spatial requirements and the minimal number of receptors which must be engaged to transmit a positive signal. T cell response percentage, latency, and calcium-signaling pattern (transient vs. sustained or oscillatory) depended on antibody density on the bead. The presence of approximately 170 anti-CD3 mAb within the contact area elicited a detectable T cell calcium response. We propose here that engagement of no more than 340 T cell receptors (approximately 1% of the total on the cell) is sufficient to initiate Ca(2+) signaling. The minimal contact area was approximately 3 micrometer(2).
Figures
References
-
- Babbitt B P, Allen P M, Matsueda G, Haber E, Unanue E R. Nature (London) 1985;317:359–361. - PubMed
-
- Valitutti S, Müller S, Cella M, Padovan E, Lanzavecchia A. Nature (London) 1995;375:148–151. - PubMed
-
- Viola A, Lanzavecchia A. Science. 1996;273:104–106. - PubMed
-
- Sheetz M P. Methods Cell Biol. 1998;55:157–171. - PubMed
-
- Yin H, Wang M D, Svoboda K, Landick R, Block S M, Gelles J. Science. 1995;270:1653–1657. - PubMed
Publication types
MeSH terms
Substances
Grants and funding
LinkOut - more resources
Full Text Sources
Other Literature Sources
Miscellaneous
