

Cross-modal reorganization of callosal connectivity without altering thalamocortical projections
- PMID: 10411947
- PMCID: PMC17588
- DOI: 10.1073/pnas.96.15.8751
Cross-modal reorganization of callosal connectivity without altering thalamocortical projections
Abstract
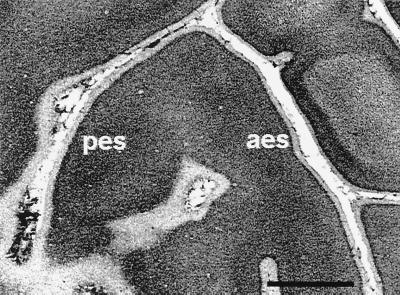
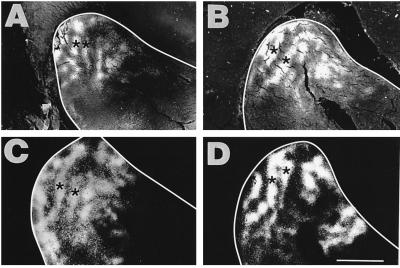
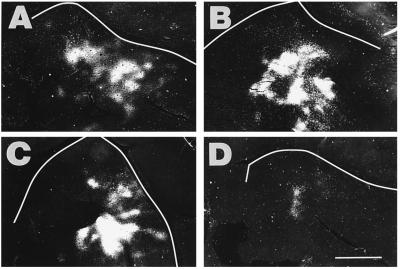
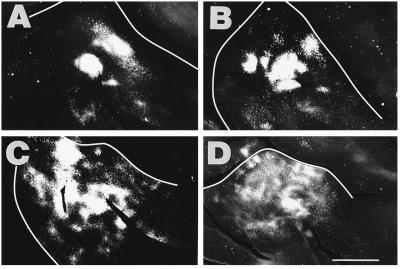
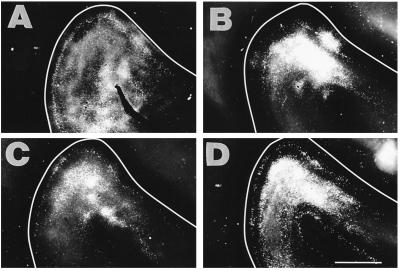
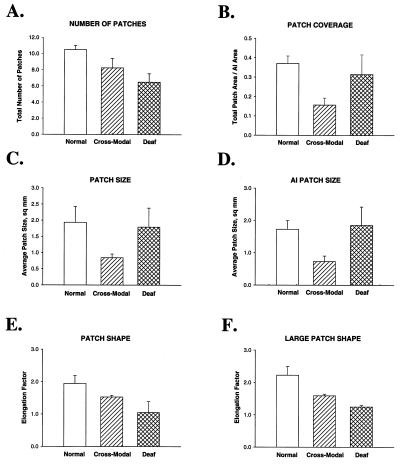
Mammalian cerebral cortex is composed of a multitude of different areas that are each specialized for a unique purpose. It is unclear whether the activity pattern and modality of sensory inputs to cortex play an important role in the development of cortical regionalization. The modality of sensory inputs to cerebral cortex can be altered experimentally. Neonatal diversion of retinal axons to the auditory thalamus (cross-modal rewiring) results in a primary auditory cortex (AI) that resembles the primary visual cortex in its visual response properties and topography. Functional reorganization could occur because the visual inputs use existing circuitry in AI, or because the early visual inputs promote changes in AI's circuitry that make it capable of constructing visual receptive field properties. The present study begins to distinguish between these possibilities by exploring whether the callosal connectivity of AI is altered by early visual experience. Here we show that early visual inputs to auditory thalamus can reorganize callosal connections in auditory cortex, causing both a reduction in their extent and a reorganization of the pattern. This result is distinctly different from that in deafened animals, which have widespread callosal connections, as in early postnatal development. Thus, profound changes in cortical circuitry can result simply from a change in the modality of afferent input. Similar changes may underlie cortical compensatory processes in deaf and blind humans.
Figures
Similar articles
-
Cross-modal reorganization of horizontal connectivity in auditory cortex without altering thalamocortical projections.J Neurosci. 1999 Sep 15;19(18):7940-50. doi: 10.1523/JNEUROSCI.19-18-07940.1999. J Neurosci. 1999. PMID: 10479695 Free PMC article.
-
Visual projections induced into the auditory pathway of ferrets: II. Corticocortical connections of primary auditory cortex.J Comp Neurol. 1993 Nov 8;337(2):317-33. doi: 10.1002/cne.903370212. J Comp Neurol. 1993. PMID: 8277005
-
Competition and convergence between auditory and cross-modal visual inputs to primary auditory cortical areas.J Neurophysiol. 2011 Apr;105(4):1558-73. doi: 10.1152/jn.00407.2010. Epub 2011 Jan 27. J Neurophysiol. 2011. PMID: 21273321 Free PMC article.
-
Role of afferent activity in the development of cortical specification.Results Probl Cell Differ. 2002;39:139-56. doi: 10.1007/978-3-540-46006-0_7. Results Probl Cell Differ. 2002. PMID: 12353467 Review.
-
Intrathalamic sensory connections mediated by the thalamic reticular nucleus.Cell Mol Life Sci. 1999 Nov 15;56(7-8):683-700. doi: 10.1007/s000180050462. Cell Mol Life Sci. 1999. PMID: 11212315 Free PMC article. Review.
Cited by
-
Cross-modal reorganization of horizontal connectivity in auditory cortex without altering thalamocortical projections.J Neurosci. 1999 Sep 15;19(18):7940-50. doi: 10.1523/JNEUROSCI.19-18-07940.1999. J Neurosci. 1999. PMID: 10479695 Free PMC article.
-
Deafness disrupts chloride transporter function and inhibitory synaptic transmission.J Neurosci. 2003 Aug 20;23(20):7516-24. doi: 10.1523/JNEUROSCI.23-20-07516.2003. J Neurosci. 2003. PMID: 12930790 Free PMC article.
-
Long-Range Optogenetic Control of Axon Guidance Overcomes Developmental Boundaries and Defects.Dev Cell. 2020 Jun 8;53(5):577-588.e7. doi: 10.1016/j.devcel.2020.05.009. Dev Cell. 2020. PMID: 32516597 Free PMC article.
-
On the relationship between maps and domains in inferotemporal cortex.Nat Rev Neurosci. 2021 Sep;22(9):573-583. doi: 10.1038/s41583-021-00490-4. Epub 2021 Aug 3. Nat Rev Neurosci. 2021. PMID: 34345018 Free PMC article. Review.
-
Bilateral cochlear implantation in the ferret: a novel animal model for behavioral studies.J Neurosci Methods. 2010 Jul 15;190(2):214-28. doi: 10.1016/j.jneumeth.2010.05.014. Epub 2010 May 31. J Neurosci Methods. 2010. PMID: 20576507 Free PMC article.
References
-
- Shatz C J. Science. 1992;258:237–238. - PubMed
-
- Levitt P, Barbe M F, Eagleson K L. Annu Rev Neurosci. 1997;20:1–24. - PubMed
-
- Neville H J, Schmidt A, Kutas M. Brain Res. 1983;266:127–132. - PubMed
-
- Neville H J. Ann N Y Acad Sci. 1990;608:71–87. - PubMed
-
- Cohen L G, Celnik P, Pascual-Leone A, Cornwell B, Faiz L, Dambrosias J, Honda M, Sadato N, Gerloff C, Catala M D, Hallett M. Nature (London) 1997;389:180–186. - PubMed
Publication types
MeSH terms
Substances
Grants and funding
LinkOut - more resources
Full Text Sources
