. 1999 Aug 1;19(15):6394-404.
doi: 10.1523/JNEUROSCI.19-15-06394.1999.

Delayed rectifier currents in rat globus pallidus neurons are attributable to Kv2.1 and Kv3.1/3.2 K(+) channels

Affiliations

Delayed rectifier currents in rat globus pallidus neurons are attributable to Kv2.1 and Kv3.1/3.2 K(+) channels

G Baranauskas et al. J Neurosci. .

Abstract

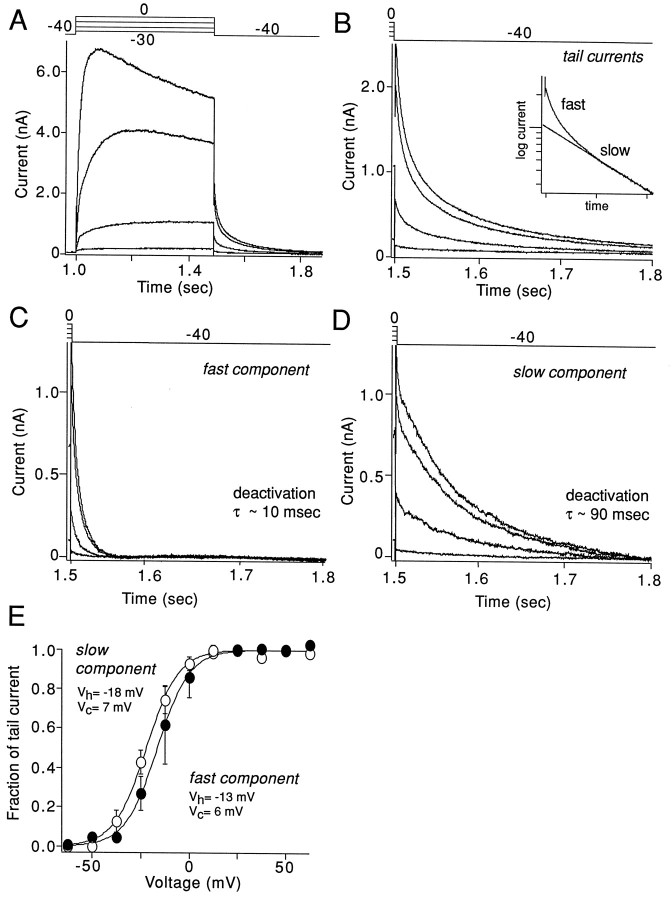
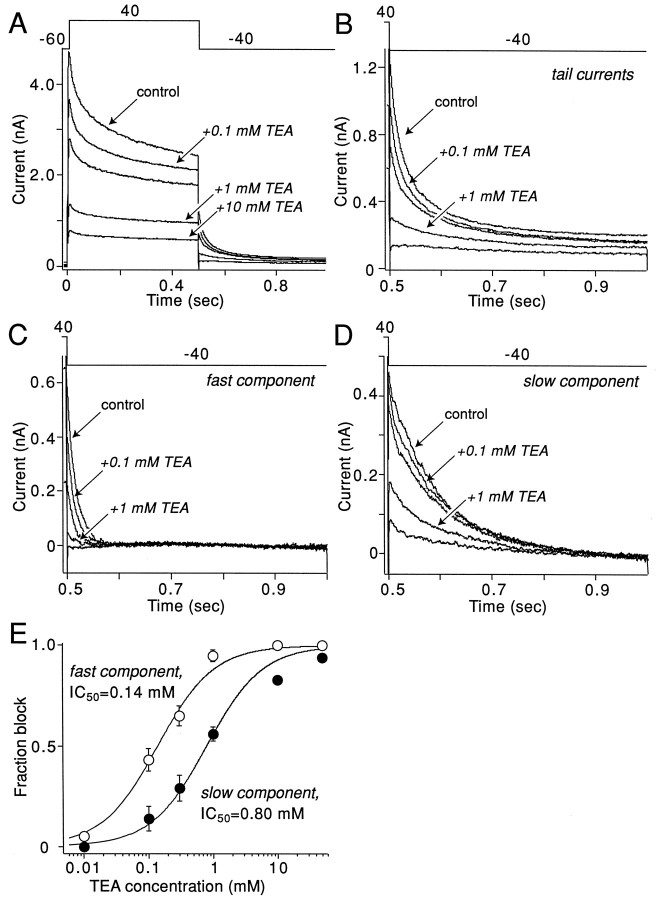
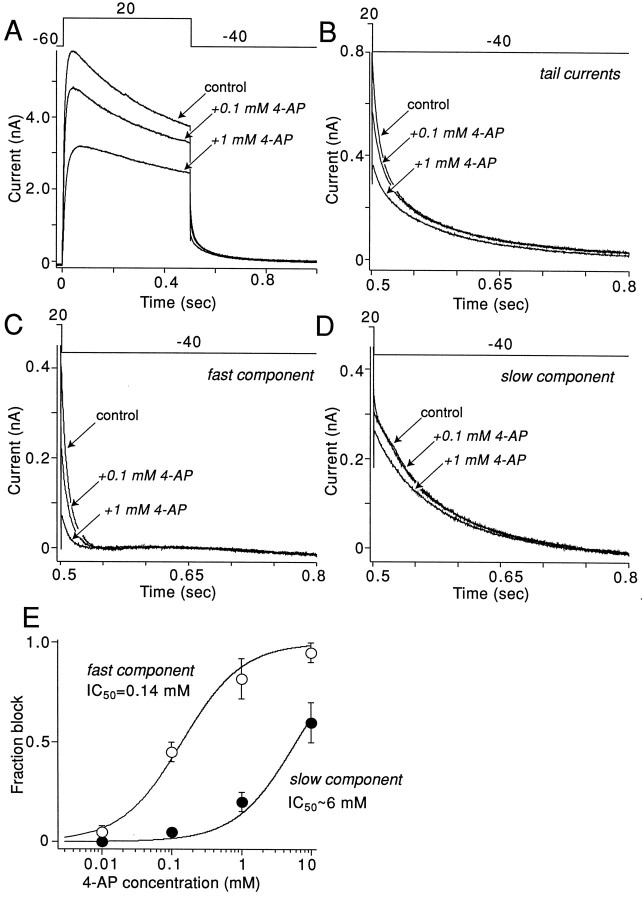
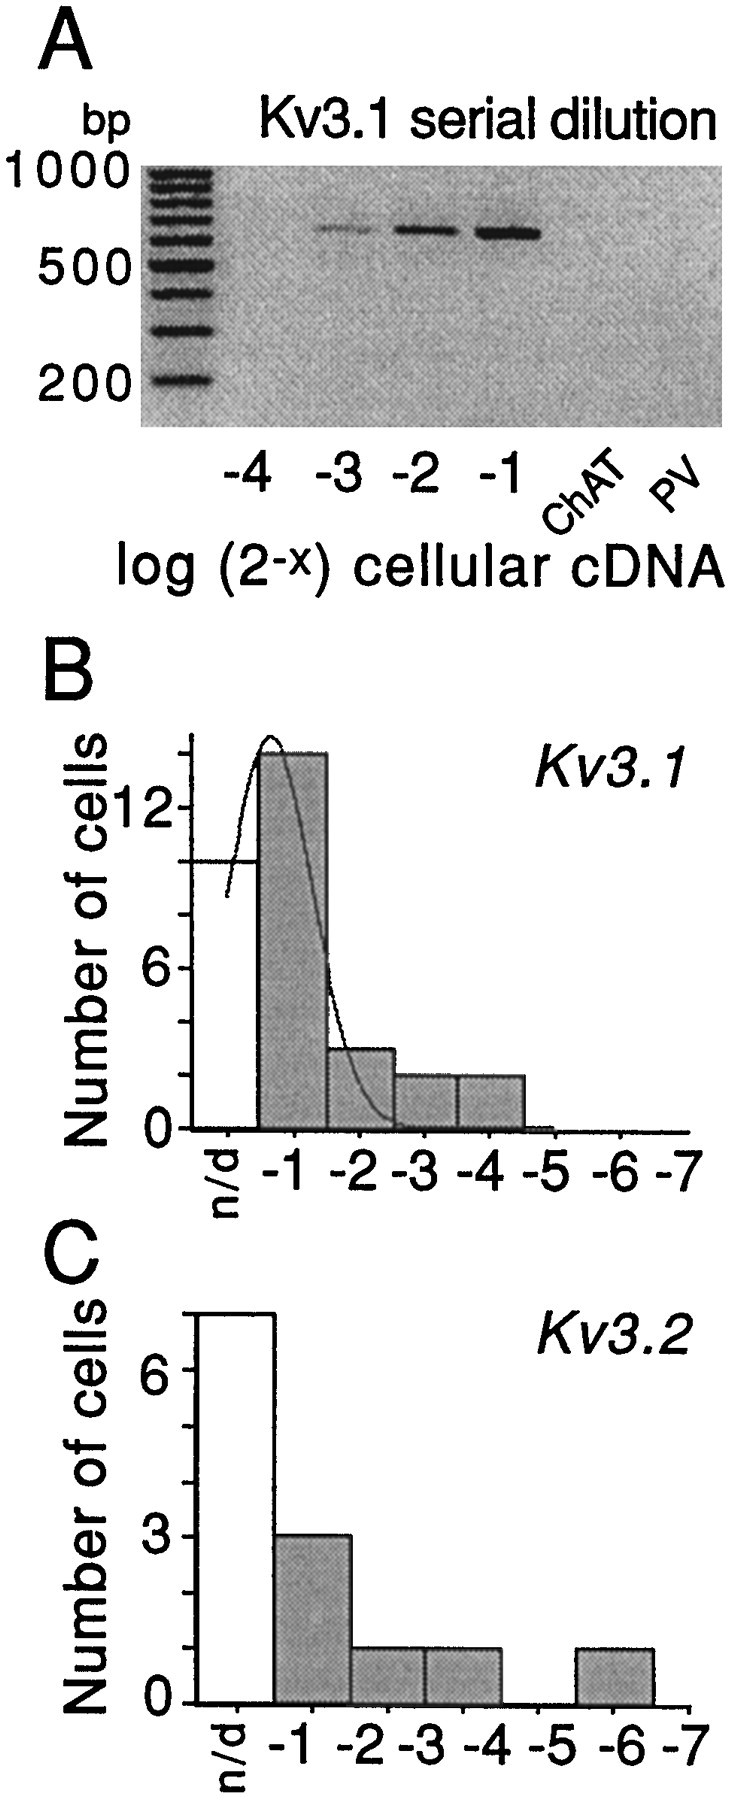
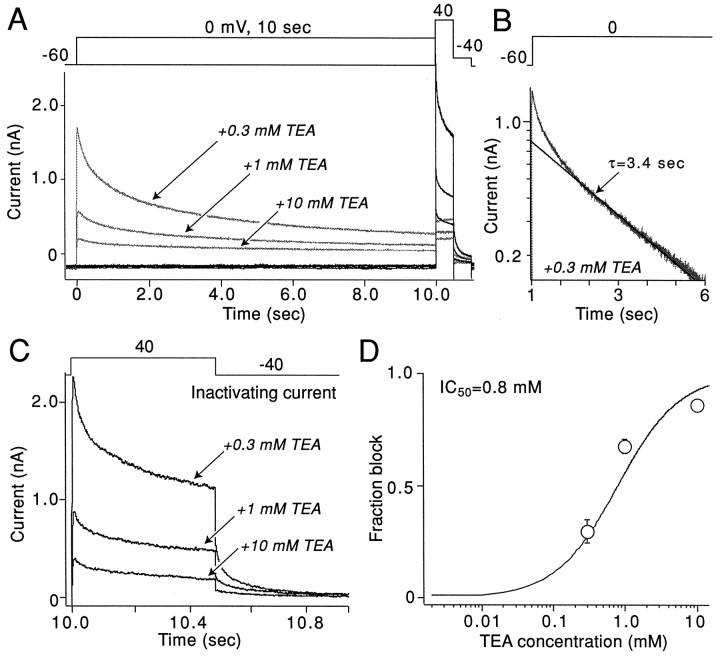
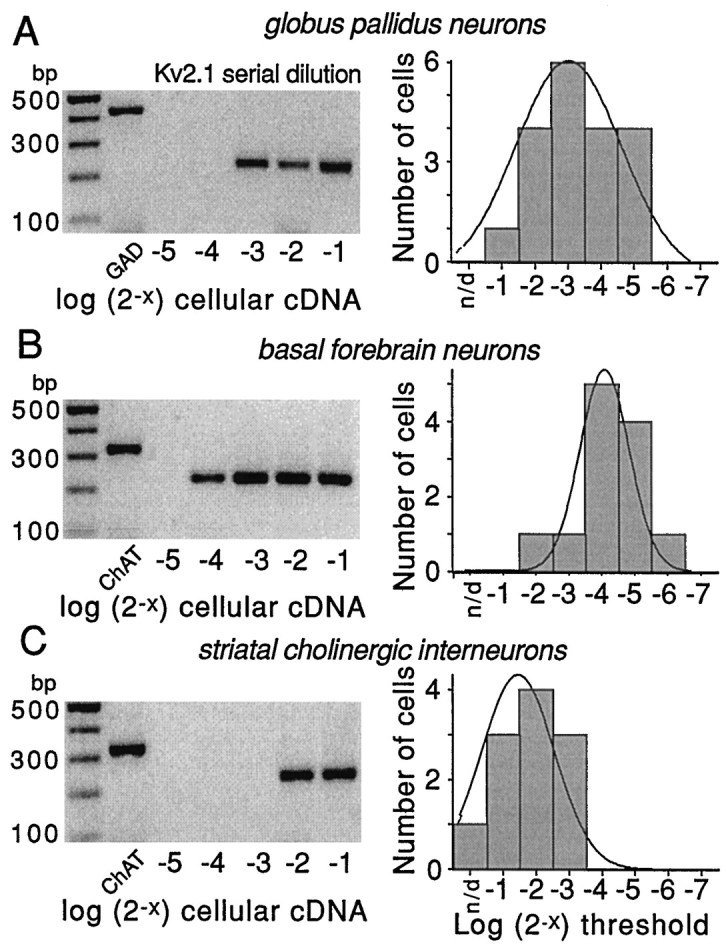
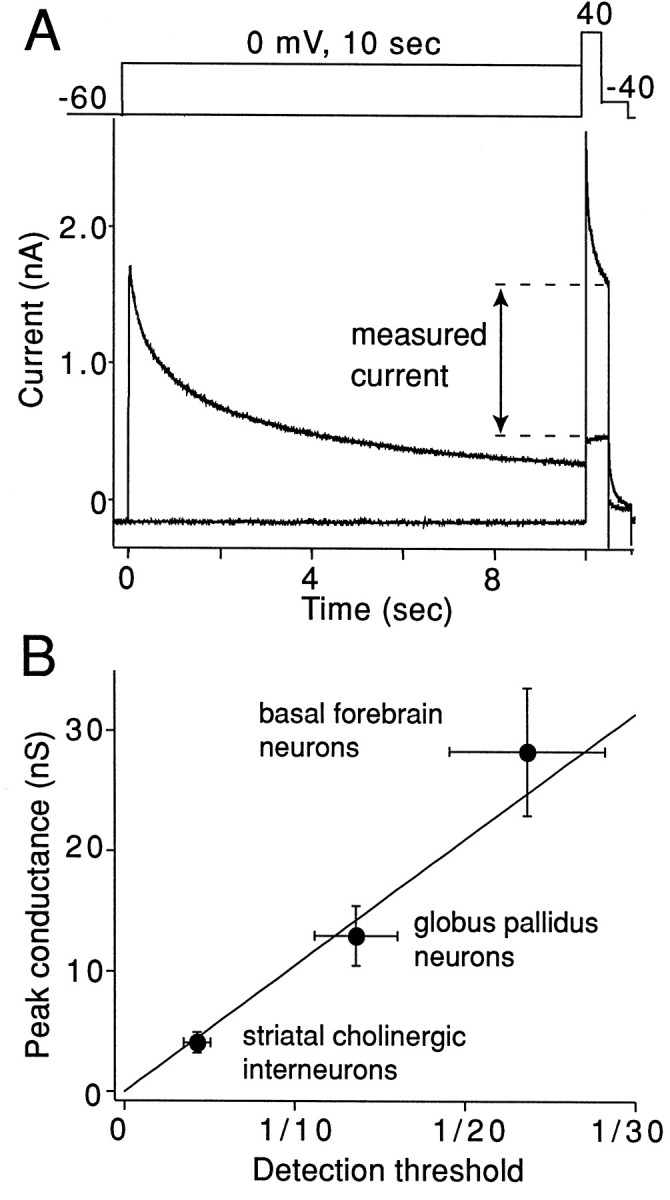
The symptoms of Parkinson disease are thought to result in part from increased burst activity in globus pallidus neurons. To gain a better understanding of the factors governing this activity, we studied delayed rectifier K(+) conductances in acutely isolated rat globus pallidus (GP) neurons, using whole-cell voltage-clamp and single-cell RT-PCR techniques. From a holding potential of -40 mV, depolarizing voltage steps in identified GP neurons evoked slowly inactivating K(+) currents. Analysis of the tail currents revealed rapidly and slowly deactivating currents of similar amplitude. The fast component of the current deactivated with a time constant of 11. 1 +/- 0.8 msec at -40 mV and was blocked by micromolar concentrations of 4-AP and TEA (K(D) approximately 140 microM). The slow component of the current deactivated with a time constant of 89 +/- 10 microseconds at -40 mV and was less sensitive to TEA (K(D) = 0.8 mM) and 4-AP (K(D) approximately 6 mM). Organic antagonists of Kv1 family channels had little or no effect on somatic currents. These properties are consistent with the hypothesis that the rapidly deactivating current is attributable to Kv3.1/3.2 channels and the slowly deactivating current to Kv2.1-containing channels. Semiquantitative single-cell RT-PCR analysis of Kv3 and Kv2 family mRNAs supported this conclusion. An alteration in the balance of these two channel types could underlie the emergence of burst firing after dopamine-depleting lesions.


Figures

Fig. 1.
Fig. 1.
Delayed rectifier currents in GP neurons have rapidly and slowly deactivating components that differ in activation voltage dependence. A, Currents evoked during voltage-clamp experiment by protocol shown at the top of each panel. B, Tail currents obtained during experiment shown in A at −40 mV membrane potential after increasingly more depolarized voltage steps. C, Rapidly deactivating component of tail currents shown in Bobtained by subtraction of steady-state and slow components of double-exponential fit. D, Slowly deactivating component of tail currents obtained by subtraction of steady-state and fast components of double-exponential fit. E, Plot of rapidly (open circles) and slowly (filled circles) deactivating tail current amplitudes as a function of the preceding voltage step for the cell shown in A. Thelines show Boltzmann fits of the experimental data;Vh is the half-activation voltage, andVc is the slope constant.
Fig. 2.
Fig. 2.
TEA differentially blocks rapidly and slowly deactivating currents. A, Currents evoked in the presence of different concentrations of TEA by the voltage-clamp protocol shown above the traces. B, Tail currents at −40 mV obtained during the experiment shown inA. C, Rapidly deactivating tail currents in increasing concentrations of TEA obtained by the subtraction method described in Figure 1. D, Slowly deactivating tail currents in increasing concentrations of TEA. E, Plot of rapidly and slowly deactivating tail current amplitudes as a function of TEA concentration. The lines represent Langmuir first-order fits of experimental data.
Fig. 3.
Fig. 3.
4-AP differentially blocks rapidly and slowly deactivating currents. A, Currents evoked in the presence of different concentrations of 4-AP by the voltage-clamp protocol shown above the traces. B, Tail currents at −40 mV obtained during the experiment shown inA. C, Rapidly deactivating tail currents in increasing concentrations of 4-AP obtained by the subtraction method described in Figure 1. D, Slowly deactivating tail currents in increasing concentrations of 4-AP. E, Plot of rapidly and slowly deactivating tail current amplitudes as a function of 4-AP concentration. The lines represent Langmuir first-order fits of experimental data.
Fig. 4.
Fig. 4.
Serial dilution experiments demonstrate that Kv3.1 and Kv3.2 mRNAs are expressed by GP neurons and that variation in detection frequency is not likely to reflect prominent subpopulations.A, Representative serial dilution gel for Kv3.1 mRNA detection in GP neuron. The first lane on theleft of gel is the marker. The first laneon the right is for PV mRNA detection with no visible PCR product band; hence, the cell was PV mRNA-negative. Thesecond band on the right is for ChAT mRNA detection with no visible PCR product band; hence the neuron was not ChAT-positive. The four lanes in betweenwere obtained after the use of an increasing (from leftto right) amount of total cellular cDNA (expressed in log2 units) to detect Kv3.1 mRNA. Note that one-eighth of the total cDNA was enough to detect Kv3.1 transcripts in this cell.B, Summary of detection thresholds for Kv3.1 mRNA detection in GP neurons. The thin line represents a Gaussian fit. C, Summary of detection thresholds for Kv3.2 mRNA detection in GP neurons.
Fig. 5.
Fig. 5.
Slowly inactivating currents have pharmacological properties similar to those of the slowly deactivating currents. A, Currents evoked by the voltage-clamp protocol shown at the top. The protocol was applied each 40 sec. The thin lines show currents evoked with a prepulse to 0 mV. The protocol was applied in the presence of 0.3, 1, and 10 mm TEA. B, Semilogarithmic plot of the current, obtained by stepping from −60 to 0 mV. The solid line shows the exponential fit of the slow component of the data; the time constant was 3.4 sec. C, Inactivating fraction of the current at +40 mV. This current was obtained by subtracting the currents evoked by the step to +40 mV without and with the 10 sec prepulse to 0 mV. D, A graph depicts the normalized amplitude of the block by TEA of the inactivating current shown in C. It was assumed that 0.3 mm TEA leaves the same fraction of inactivating current as seen Figure 2,D and E.
Fig. 6.
Fig. 6.
Serial dilution experiments demonstrate differences in Kv2.1 mRNA abundance in three cell types. Representative serial dilution gels for each cell type are shown on the left side of each panel. The first lane on theleft of gels is the marker; the second lane is a phenotyping transcript (GAD67 or ChAT). Thelast five lanes are Kv2.1 amplicons produced by runs with increasing fractions of total cellular cDNA (expressed in log2 units). Note that in all three cells the use of one-half of the total cellular cDNA resulted in detection. However, only 1/16th of the total cDNA was sufficient in basal forebrain cholinergic neurons. On the right side of each panel is the distribution of detection thresholds for Kv2.1 mRNA in that cell type. Note that Kv2.1 mRNA appeared to be most abundant in the basal forebrain cholinergic neurons, of intermediate abundance in GP neurons, and least abundant in striatal cholinergic interneurons. Thethin line is a Gaussian fit of the distribution.
Fig. 7.
Fig. 7.
Kv2.1-like currents are related linearly to estimates of Kv2.1 mRNA abundance. A, K+ currents were evoked by the voltage-clamp protocol shown above the traces. Currents evoked with and without a prepulse to 0 mV are superimposed. Protocols were separated by a 40 sec recovery period. B, Average amplitudes of the measured current in three cell types (filled circles) are plotted against the average of detection threshold obtained from the data shown in Figure 6(right panels). The line represents the regression line fit to the data points (R2 = 0.98). The thin lines from the filled circles represent SEM for the current amplitude (vertical lines) and for the detection threshold (horizontal lines).

References

    1. Albin RL, Young AB, Penney JB. The functional anatomy of basal ganglia disorders [see comments]. Trends Neurosci. 1989;12:366–375. - PubMed
    1. Armstrong DM, Saper CB, Levey AI, Wainer BH, Terry RD. Distribution of cholinergic neurons in rat brain: demonstrated by the immunocytochemical localization of choline acetyltransferase. J Comp Neurol. 1983;216:53–68. - PubMed
    1. Baro DJ, Levini RM, Kim MT, Willms AR, Lanning CC, Rodriguez HE, Harris-Warrick RM. Quantitative single-cell reverse transcription-PCR demonstrates that A-current magnitude varies as a linear function of shal gene expression in identified stomatogastric neurons. J Neurosci. 1997;17:6597–6610. - PMC - PubMed
    1. Bergman H, Feingold A, Nini A, Raz A, Slovin H, Abeles M, Vaadia E. Physiological aspects of information processing in the basal ganglia of normal and parkinsonian primates. Trends Neurosci. 1998;21:32–38. - PubMed
    1. Blaine JT, Ribera AB. Heteromultimeric potassium channels formed by members of the Kv2 subfamily. J Neurosci. 1998;18:9585–9593. - PMC - PubMed

Publication types

MeSH terms