. 1999 Aug 1;19(15):6599-609.
doi: 10.1523/JNEUROSCI.19-15-06599.1999.

Smell and taste perception in Drosophila melanogaster larva: toxin expression studies in chemosensory neurons

Affiliations

Smell and taste perception in Drosophila melanogaster larva: toxin expression studies in chemosensory neurons

G Heimbeck et al. J Neurosci. .

Abstract

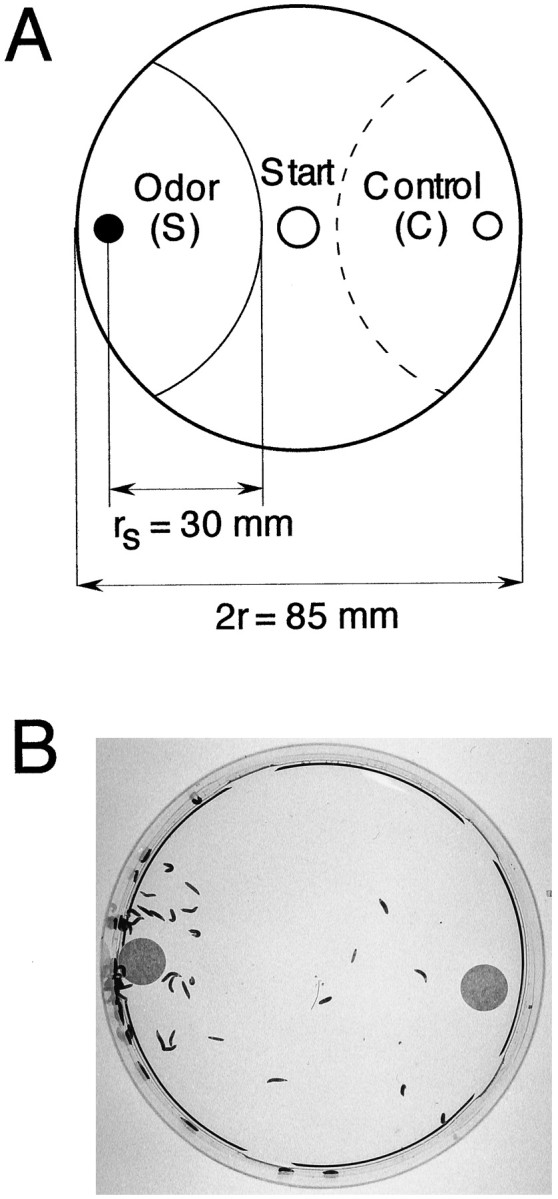
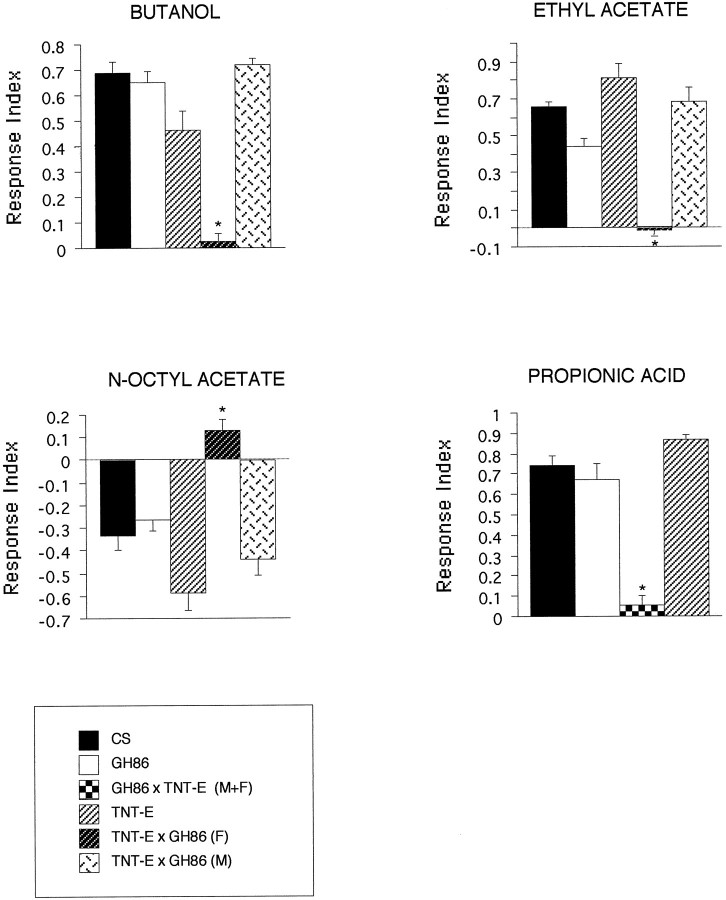
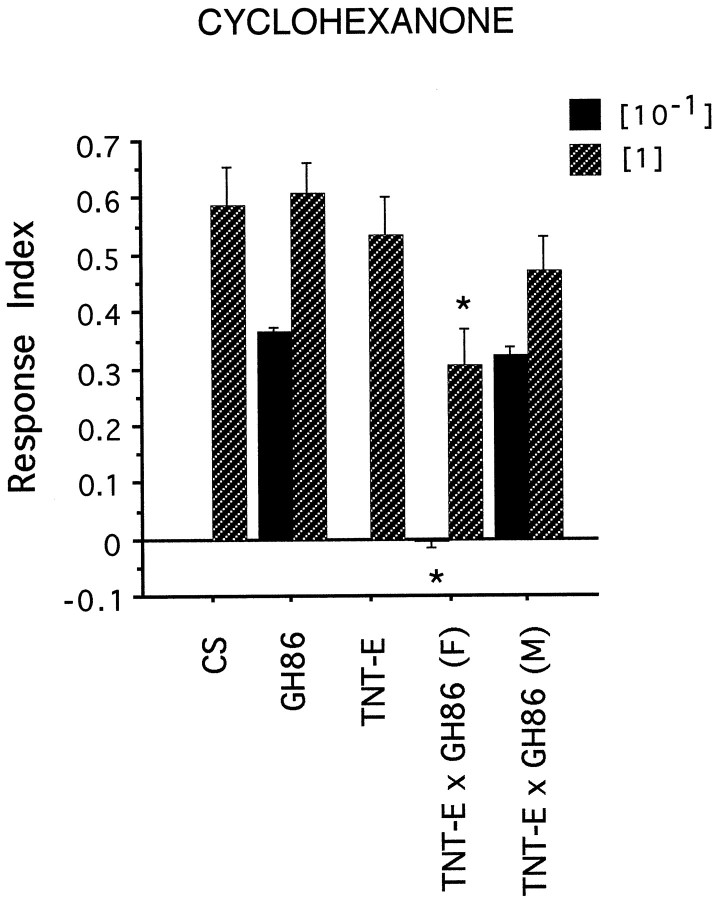
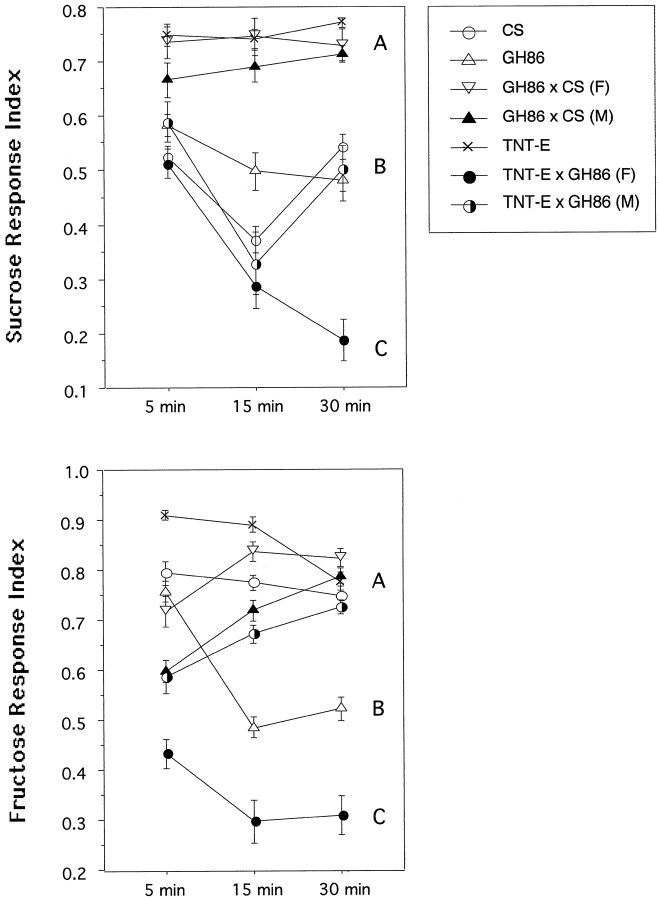
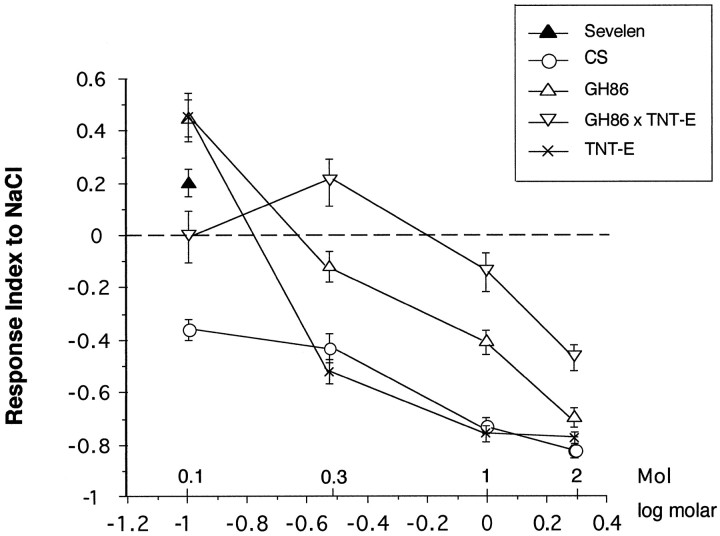
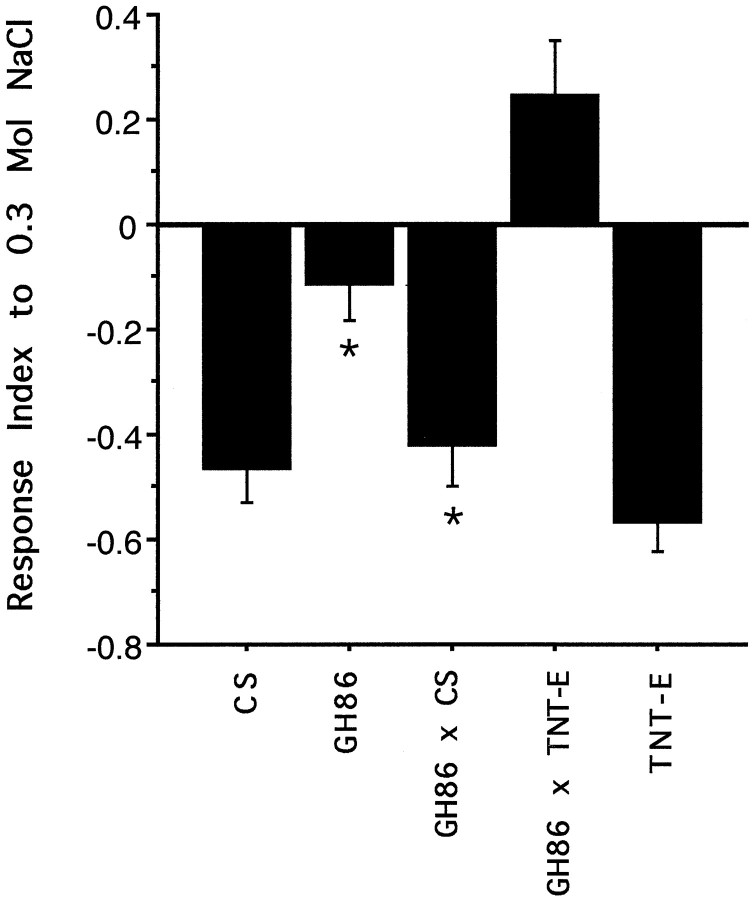
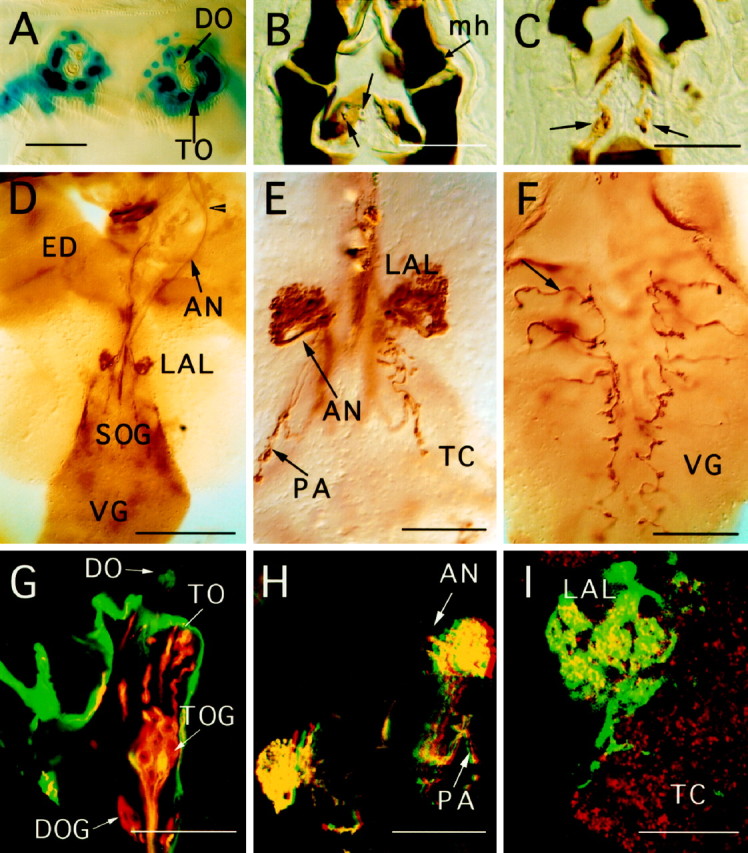
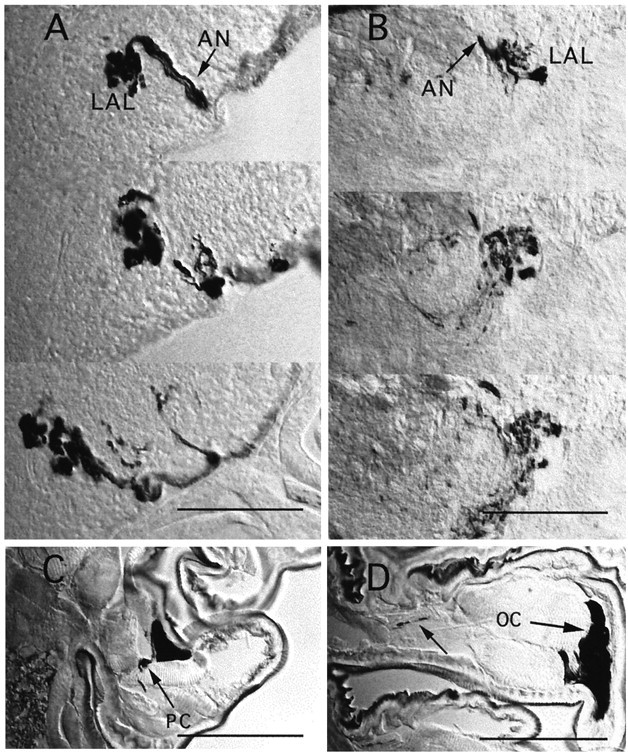
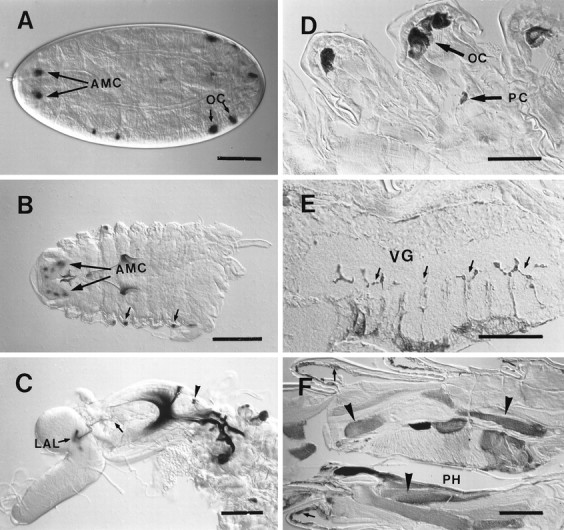
GAL4-driven targeted expression of tetanus toxin light chain (UAS-TeTxLC) in a subset of chemosensory neurons of the larval antennomaxillary complex (AMC) and pharynx causes abnormal chemosensory behavior in Drosophila melanogaster. Consistent with strongest staining in the dorsal organ (DO), the presumed olfactory organ of the AMC, tetanus toxin-expressing larvae subjected to an olfactory preference assay show anosmic behavior to most volatile substances tested. Furthermore, we observed reduced responses to sodium chloride, fructose, and sucrose in gustatory plate assays. Surprisingly, the entire subset of labeled sensory neurons from the terminal (maxillary) organ (TO) of the AMC was found to project via the antennal nerve to the larval antennal lobe region. The maxillary nerve remained completely unstained. Hence, a subset of neurons from the TO builds an anatomical entity with projections from the DO. Our results suggest that the AMC contains both olfactory and gustatory sensilla, and that the DO is the main olfactory organ in larvae.


Figures

Fig. 1.
Fig. 1.
Olfactory larval plate assay. A, Schematic representation of the test setup. Small filter disks containing a test chemical (S) and control diluent (C) are placed on opposite sides of a Petri dish covered with a layer of agarose. Fifty animals are transferred to the start point and counted after 5 min in indicated semicircular areas. For calculation of response, see Materials and Methods. B, Larval plate assay of wild-type CS. The filter on the left contains 1 μl of undiluted propionic acid. The picture was taken 5 min after the test start.
Fig. 2.
Fig. 2.
Odor-controlled behavior is severely impaired in larvae expressing TeTxLC driven by P[GAL4] in line GH86. Control lines CS, GH86, and TNT-E are homozygous. To indicate the genetic background of the tested animals, the genotypes of F1 larvae are always described by the parental cross; mothers are written on the left and fathers on theright of ×; e.g., a cross TNT-E × GH86 results in female (F) larvae, which contain the P[GAL4] element on the X chromosome and the UAS-TeTxLC construct on the second chromosome and males (M) lacking the P[GAL4] element. Consequently, only the females (F) are subject to TeTxLC expression. The reciprocal cross (GH86 × TNT-E) results in both males and females expressing TeTxLC. One microliter of undiluted butanol, ethyl acetate, and propionic acid and 2 μl of n-octyl acetate were used for the tests. Each bar consists of 5–10 independent tests. Error bars indicate SEM. For calculation of the RI, refer to Materials and Methods. Positive RIs indicate attraction; RI = 0 indicates indifferent behavior; and negative RI indicates aversion. Asterisks denote animals that express TeTxLC. Differences betweenTeTxLC-expressing animals and control lines are statistically highly significant (p < 0.005).
Fig. 3.
Fig. 3.
Undiluted cyclohexanone (1 μl) elicits a positive reaction in TNT-E × GH86 (F) larvae (concentration [1]). However, the response is significantly reduced, when compared with control lines GH86 (p = 0.007), wild-type CS (p = 0.01), and TNT-E (p = 0.03). No significant difference can be found from their male siblings GH86 × TNT-E (M) (p = 0.07). A dilution of [10−1] (1 μl) is sufficient to cause an indifferent behavior, which is statistically different from controls, male siblings, and GH86 homozygous larvae (p≤ 0.002). Abbrevations for larval genotypes are the same as in Figure2.
Fig. 4.
Fig. 4.
Effect of TeTxLC expression on responses to fructose and sucrose. The behavior of the same animals was monitored over 30 min. Animals were counted at the indicated time, and an RI was calculated as described in Materials and Methods. The concentration of both sugars was 1 m. Error bars indicate 0.5 × SEM. Each dot represents the mean of 10 independent tests. AC, Significantly different response groups after 30 min assay time.
Fig. 5.
Fig. 5.
Response to NaCl. The response curve of animals subject to TeTxLC expression shows a reduced sensitivity at all tested concentrations compared with control lines. At 0.3m these larvae are clearly attracted by NaCl, whereas their parent lines GH86 and TNT-E are still repelled. Error bars indicate 0.5 × SEM. Each point represents the mean of 10 independent tests.
Fig. 6.
Fig. 6.
Test for a possible mutant effect attributable to the P element insertion. The reduced sensitivity of line GH86 to NaCl, as shown in the response curve in Figure 5, is not caused by the P element insertion. Heterozygotes GH86/CS from a cross GH86 (F) × CS (M) behave like the wild-type control CS in a test with 0.3m NaCl, despite the presence of the P element. Error bars indicate SEM. Each column includes 10 independent tests of 50 animals each.
Fig. 7.
Fig. 7.
GAL4-driven expression pattern of line GH86 in third larval instar, using different UAS reporter genes. For tetanus toxin expression, the active UAS-TeTxLC was used in all preparations. All photographs are oriented with anterior ontop. A, Nuclear lacZ staining of chemosensory neurons of the DO and TO in a whole-mount preparation, showing 30–35 nuclei per side. B, C, Consecutive 10 μm cryosections stained with anti-tetanus antibody.Arrows indicate cuticular structures of the internal mouth organ and the corresponding chemosensory neurons.mh, Mouth hook. D, Overview of projection patterns visualized by anti-tetanus staining of a larval brain whole-mount preparation. The arrowhead marks the fusion point of projections from the TO with the AN. Afferent fibers arborize inside the LAL. ED, Eye-antennal imaginal disk;VG, ventral ganglion. E, Arborizations of AMC projections and fibers from pharyngeal sensilla (PA) at a higher magnification. F, Afferents (arrow) from the thoracicoabdominal peripheral nervous system shown in a whole-mount preparation of the VG. Irregularities of the arborization pattern can be seen along the midline. G, Confocal image of a section of the AMC. A UAS-GFP reporter construct was used to show expression of line GH86 in the AMC in greater detail (green). Counterstaining of chemosensory neurons was done with mAb 22C10 (red). Overlapping staining of GFP and mAb 22C10 is seen in yellow. Note that only two of eight neurons of the TO ganglion (TOG) show GFP expression in this focal plane. Intensely labeled GFP expression is seen in the dome region of the DO, and dendrites of the TO are strongly stained in red and yellow. Non-neuronal cells of the epidermis express large amounts of GFP. H,Red–green stereo image of chemosensory arborizations in the larval brain (UAS-GFP). Arborizations of the PA are detected in a different focal plane. I, Higher magnification of the GFP pattern in LAL shows local concentration of arborizations in a grape-like manner. A general neuropil staining was achieved with mAb nc82 in red. Scale bars: A–C, E, F, H, 50 μm; G, I, 25 μm; D, 200 μm.
Fig. 8.
Fig. 8.
Anatomical differences betweenUAS-tau and UAS-TeTxLC expression.A, B, Two series of 10 μm cryosections through the LAL region of third instar larvae, showing TeTxLC staining (A) and TAU staining (B). The denser appearance of LAL projections in A, compared with B, suggests structural changes of presynaptic arborizations in afferents expressing active TeTxLC.C, Peripheral neuron of unknown identity (PC) stained in a thoracic segment. D, Strong oenocyte (OC) staining and faint axon staining (arrow) inside a peripheral nerve. Scale bars, 50 μm.
Fig. 9.
Fig. 9.
Expression pattern of line GH86 during development. AC,UAS-lacZ; DF,UAS-TeTxLC reporter genes. A, Expression is first detected in stage 17 embryos the AMC and oenocytes (OC); dorsal view on embryo, anterior is to theleft. B, First larval instar shows similar staining pattern as late embryos; small arrowspoint to oenocytes. C, Staining becomes stronger in second instar larva; the arborization pattern of AMC projections (arrow) inside the LAL is identical with third instar (see Fig. 7D,E). The arrowhead indicates cells of the pharyngeal mouth organ. D, E, Staining of cell bodies of peripheral neurons (PC), oenocyte staining (OC), and axons (E, arrows) entering the ventral ganglion (VG) are detected in second instar larvae using anti-TeTxLC antibodies. F, Expression in epidermis (arrows) and some muscles (arrowheads) of the pharynx (PH) is only found in third instar larva. Scale bars: A, C, F, 100 μm; B, D, E, 50 μm.

Similar articles

Cited by

References

    1. Aceves-Piña EO, Quinn WG. Learning in normal and mutant Drosophila larvae. Science. 1979;206:93–95. - PubMed
    1. Altner H, Prillinger L. Ultrastructure of invertebrate chemo-, thermo-, and hygroreceptors and its functional significance. Int Rev Cytol. 1980;67:69–131.
    1. Altner H, Sass H, Altner I. Relationship between structure and function of antennal chemo-, hygro-, and thermoreceptive sensilla in Periplaneta americana. Cell Tissue Res. 1977;176:389–405. - PubMed
    1. Ashburner M. Drosophila. A laboratory manual. Cold Spring Harbor Laboratory; Cold Spring Harbor, NY: 1989.
    1. Ayyub C, Paranjape J, Rodriques V, Siddiqi O. Genetics of the olfactory behaviour in Drosophila melanogaster. J Neurogenet. 1990;6:285–262. - PubMed

Publication types

MeSH terms

LinkOut - more resources