. 1999 Aug;58(8):493-9.
doi: 10.1136/ard.58.8.493.

Quantitative analysis of synovial membrane inflammation: a comparison between automated and conventional microscopic measurements

Affiliations

Quantitative analysis of synovial membrane inflammation: a comparison between automated and conventional microscopic measurements

G Cunnane et al. Ann Rheum Dis. 1999 Aug.

Abstract

Objective: The objective of this study was to quantify selected features of chronic synovial tissue inflammation by computerised image analysis and to validate the results by comparison with conventional microscopic measurements.

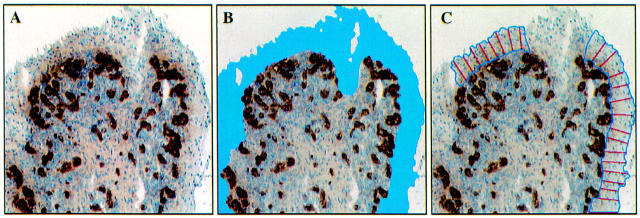
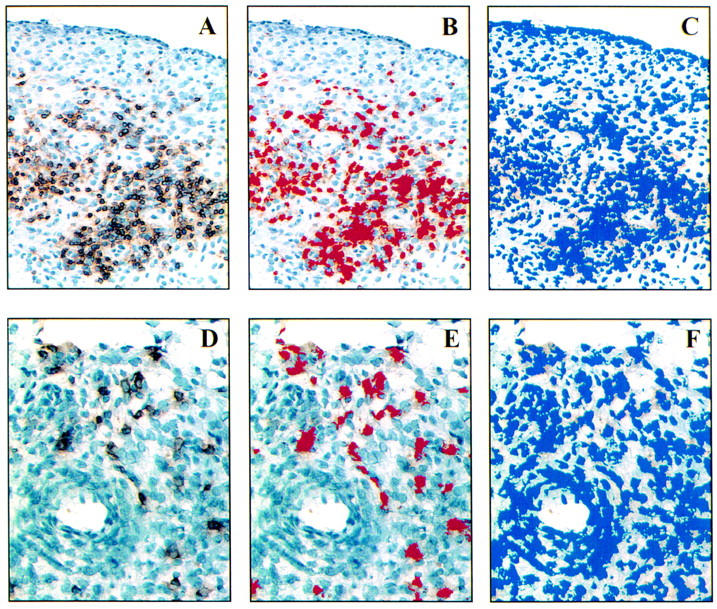
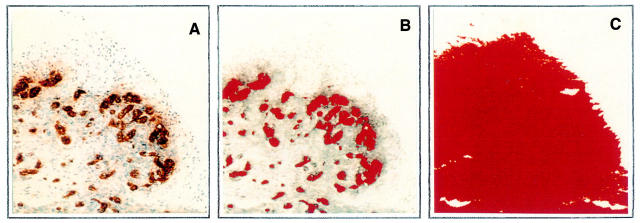
Methods: Synovial biopsy samples were obtained from the knee joints of patients with chronic arthritis and prepared for immunohistochemical analysis using standard techniques. Following the development of special software, four parameters of chronic synovial inflammation were evaluated: intimal layer thickness, CD3+ cell infiltration, CD8+ cell infiltration and vascularity. Intimal layer thickness was expressed in microns. The intensity of CD3+ and CD8+ cell infiltration was expressed as the percentage area of the tissue section occupied by positively stained cells. Vascularity was expressed as the percentage area occupied by blood vessels. Conventional quantitative microscopic analysis was also undertaken and the results from both methods compared.

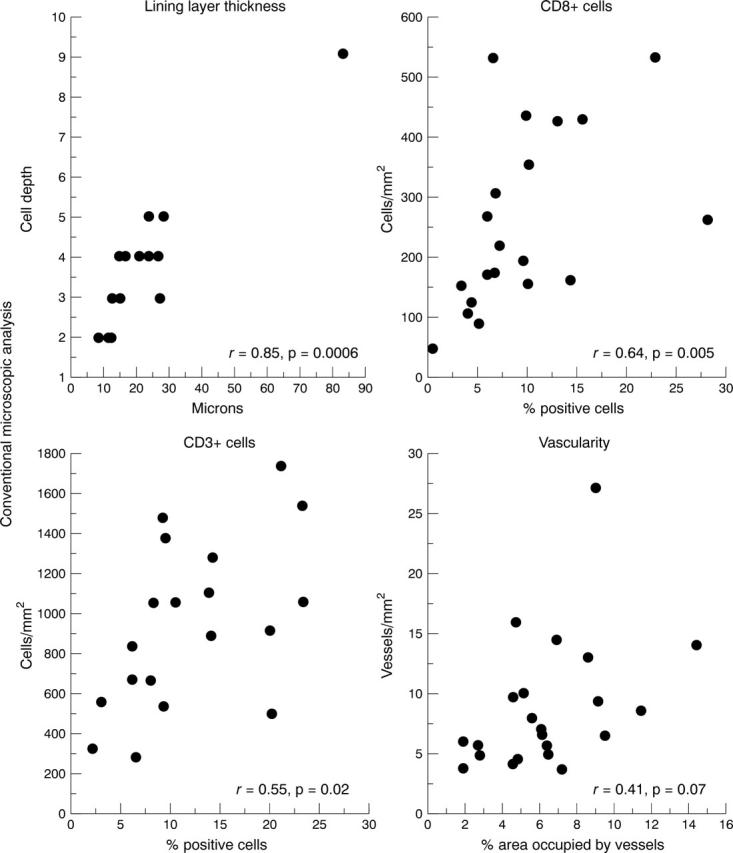
Results: Seventy eight tissue sections were selected for study. Measurements of intimal layer thickness by both techniques correlated strongly: r = 0.85, p = 0.0006. Measurements of CD8+ cell infiltration, usually widely dispersed, also correlated well: r = 0.64, p = 0.005. Measurements of CD3+ cell infiltration, often densely aggregated, correlated less well: r = 0.55, p = 0.02. Measurements of vascularity demonstrated no statistically significant correlation: r = 0.41, p = 0.07. Proficiency in the use of computerised image analysis was readily acquired.

Conclusion: Computerised image analysis was successfully applied to the measurement of some features of synovial tissue inflammation. Further software development is required to validate measurement of blood vessels of variable size.


Figures

Figure 1
Figure 1
Automated measurement of lining layer thickness. The tissue section is stained for von Willebrand factor (A). The lining layer contains no blood vessels and is easily identified (B). Perpendicular lines at 20-30 µm intervals represent the lining layer thickness (C). The middle section of the lining layer is interupted by a cutting artefact.
Figure 2
Figure 2
Automated measurement of CD3+ and CD8+ cell infiltration. The panels illustrate the interactive steps in the computerised image analysis routine for quantifying areas occupied by CD3+ cells (A, B, C) and CD8+ cells (D, E, F). Panels on left (A and D) demonstrate the digital images of stained cells acquired from the microscope. The middle panels (B and E) outline in pseudocolours the area occupied by immunohistochemically stained cells as judged by the computer. Panels on right (C and F) illustrate the total area of haematoxylin stained nucleated cells outlined in pseudocolours. The area occupied by CD3+ cells is 18 200 µm2 (B) and of total haematoxylin stained 53 100 µm2 (C) representing an incidence of 34.3% CD3+ cells in this area. CD8+ cells covers an area of 3400 µm2 (E) and total cells 29 700 µm2 (F), indicating 11.4% CD8+ T cells in this field.
Figure 3
Figure 3
Automated measurement of vascularity. Following staining with von Willebrand factor the left panel (A) represents the digital image of blood vessels acquired from the microscope. The middle panel (B) outlines in pseudocolour the area occupied by the blood vessels, including the endothelial cells and lumen. The right panel (C) illustrates the total tissue area analysed for vascularity depicted in red pseudocolour by the computer. The blood vessels occupy an area of 29 300 µm2 (B) while the total tissue area is 143 000 µm2 (C), meaning that the vascular area in this field represent 20.5% of the total area.
Figure 4
Figure 4
Correlations between computerised image analysis and conventional microscopic analysis of synovial tissue inflammation using Spearman rank correlation statistics.

References

    1. Arthritis Rheum. 1995 Oct;38(10):1457-65 - PubMed
    1. Eur J Immunol. 1996 Jan;26(1):1-9 - PubMed
    1. Arthritis Rheum. 1991 Sep;34(9):1094-105 - PubMed
    1. Hum Pathol. 1995 Dec;26(12):1329-32 - PubMed
    1. Am J Clin Pathol. 1996 Jun;105(6):705-10 - PubMed