. 1999 Aug 1;518 ( Pt 3)(Pt 3):639-51.
doi: 10.1111/j.1469-7793.1999.0639p.x.

Single-channel properties of BK-type calcium-activated potassium channels at a cholinergic presynaptic nerve terminal

Affiliations

Single-channel properties of BK-type calcium-activated potassium channels at a cholinergic presynaptic nerve terminal

X P Sun et al. J Physiol. .

Abstract

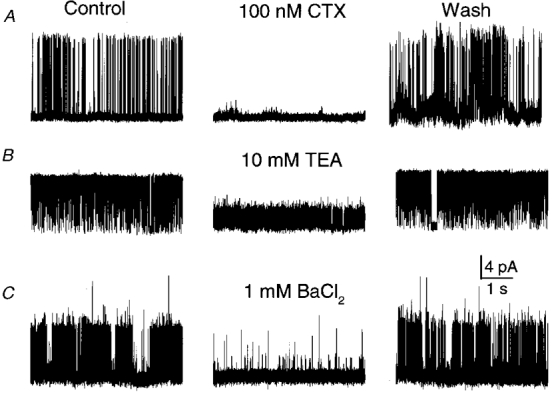
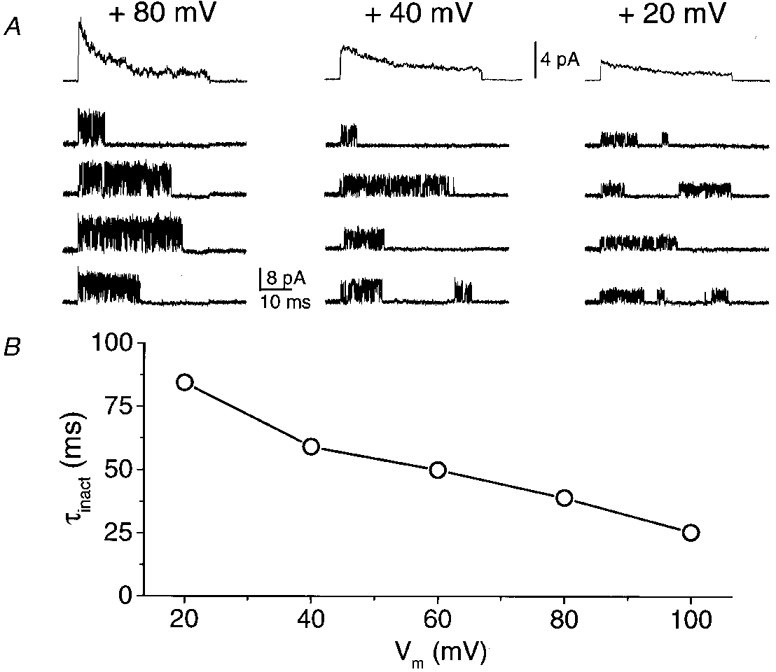
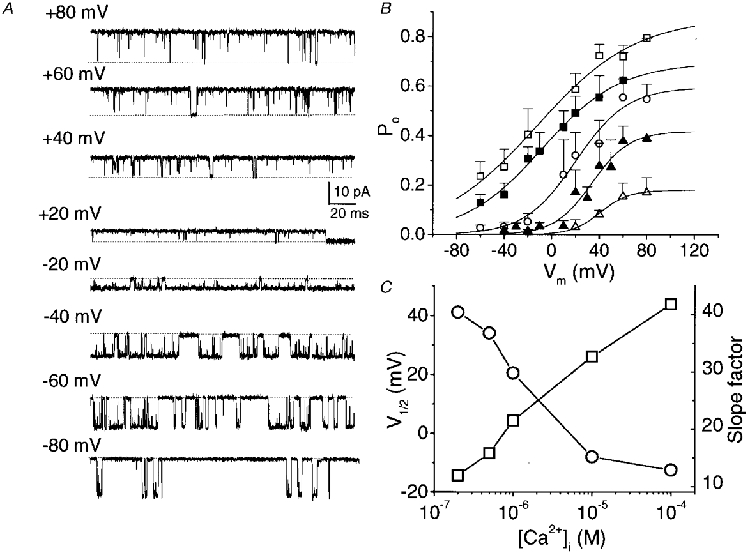
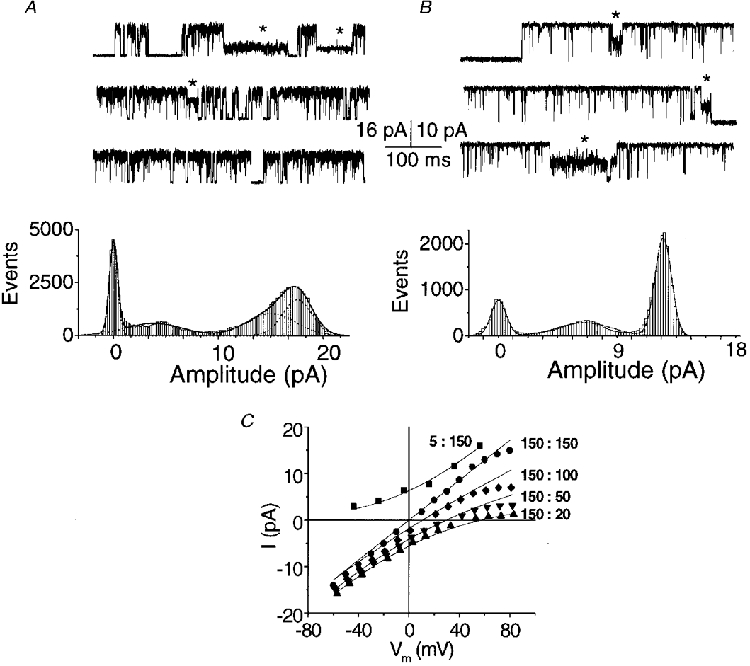
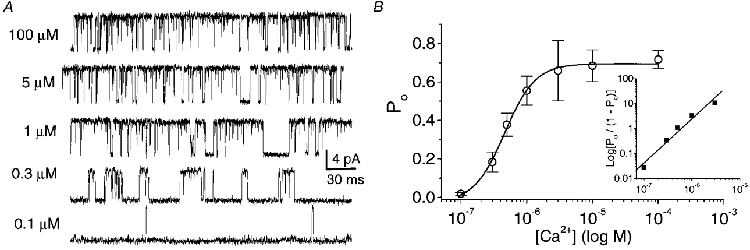
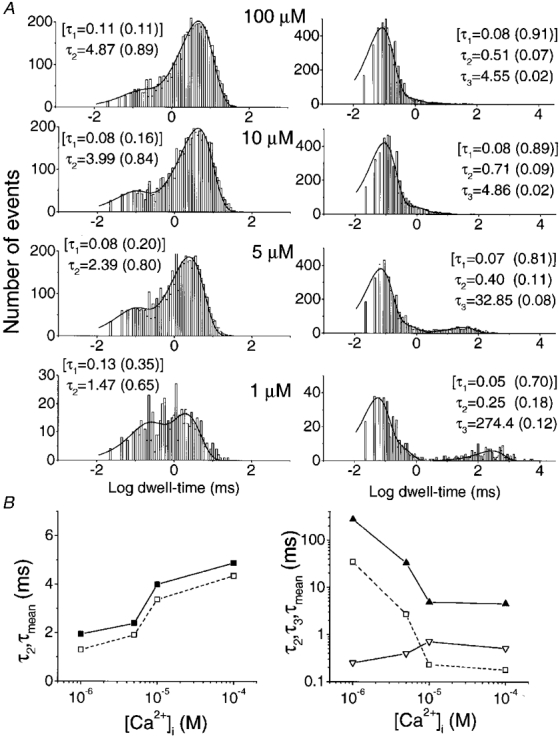
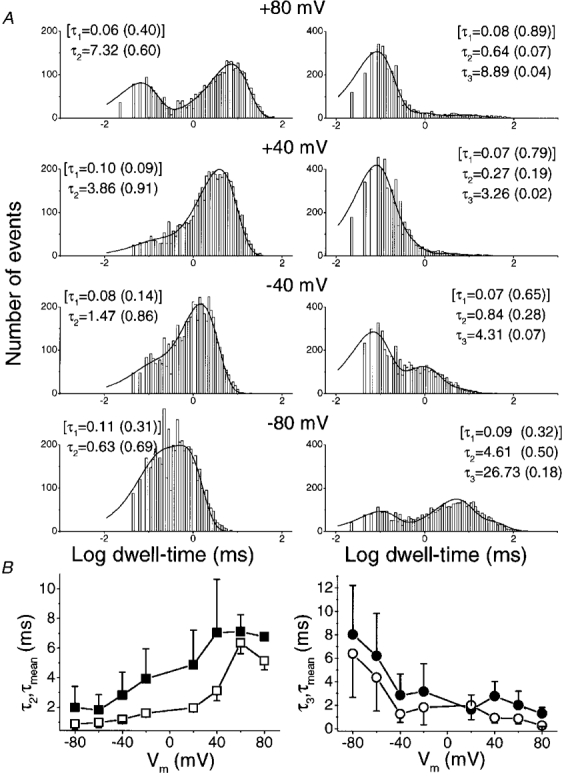
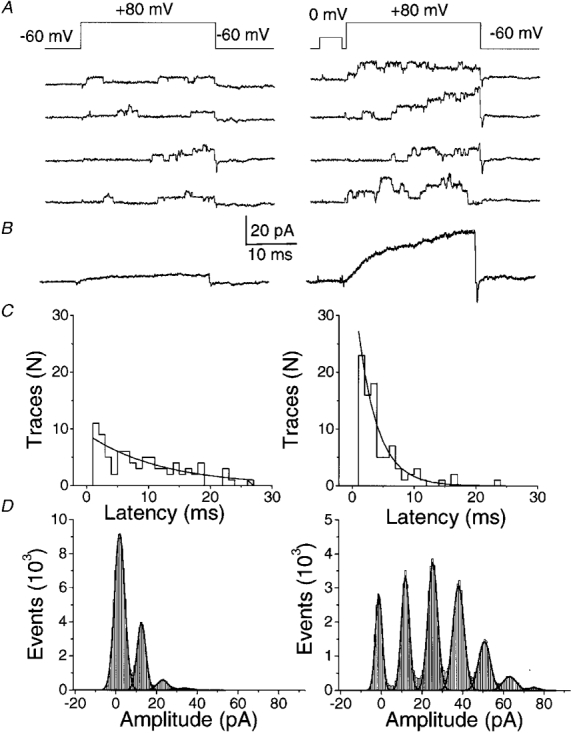
1. A high-conductance calcium-activated potassium channel (BK KCa) was characterized at a cholinergic presynaptic nerve terminal using the calyx synapse isolated from the chick ciliary ganglion. 2. The channel had a conductance of 210 pS in a 150 mM:150 mM K+ gradient, was highly selective for K+ over Na+, and was sensitive to block by external charybdotoxin or tetraethylammonium (TEA) and by internal Ba2+. At +60 mV it was activated by cytoplasmic calcium [Ca2+]i with a Kd of approximately 0.5 microM and a Hill coefficient of approximately 2.0. At 10 microM [Ca2+]i the channel was 50 % activated (V) at -8.0 mV with a voltage dependence (Boltzmann slope-factor) of 32.7 mV. The V values hyperpolarized with an increase in [Ca2+]i while the slope factors decreased. There were no overt differences in conductance or [Ca2+]i sensitivity between BK channels from the transmitter release face and the non-release face. 3. Open and closed times were fitted by two and three exponentials, respectively. The slow time constants were strongly affected by both [Ca2+]i and membrane potential changes. 4. In cell-attached patch recordings BK channel opening was enhanced by a prepulse permissive for calcium influx through the patch, suggesting that the channel can be activated by calcium ion influx through neighbouring calcium channels. 5. The properties of the presynaptic BK channel are well suited for rapid activation during the presynaptic depolarization and Ca2+ influx that are associated with transmitter release. This channel may play an important role in terminating release by rapid repolarization of the action potential.


Figures

Figure 1
Figure 1. Effect of blockers on single KCa channels in isolated patches
Block by external CTX (A) or TEA (B), recorded in outside-out patches, or by internal Ba2+ (C), recorded from an inside-out patch, were all reversible. Channel openings are upward. Symmetrical 150 mM K+ was used with 100 μM [Ca2+]i on the cytoplasmic face. Membrane potential: +60 mV in A, +40 mV in B and C.
Figure 7
Figure 7. Inactivation of single-channel BK currents
A, each panel shows recordings of a single KCa channel in an inside-out patch during voltage steps from Vh= -70 mV to the indicated potentials. The bottom four traces are representative recordings whilst the top trace is the ensemble average of 100 traces. This behaviour was only observed in a few patches. B, the decay of each ensemble average was fitted to a single exponential and the time constant (τinact) plotted as a function of the membrane potential. Symmetrical 150 mM K+ solutions were used, with 10 μM [Ca2+]i.
Figure 4
Figure 4. Voltage dependence of BK channels at different [Ca2+]i
A, BK channel activity recorded at a range of membrane potentials in symmetrical K+ (150 mM) with 100 μM [Ca2+]i. B, Po as a function of membrane potential at various [Ca2+]i (μM): □, 100; ▪, 10; ^, 1; ▴, 0.5; ▵, 0.2. Each point represents the mean of single channels in 3-8 different patches. Smooth curves are fitted with Boltzmann relations which were set to Po(min)→ 0. C, plot of V½ (^) and slope factors (□) derived from the Boltzmann fits to the data in B against [Ca2+]i.
Figure 2
Figure 2. Single-channel KCa currents, subconductance states and cation selectivity
A and B, two examples of current fluctuations (upper panels) and all-points histograms with fitted Gaussian distributions (lower panels) in inside-out membrane patches held at +60 mV with 10 μM [Ca2+]i. Channel openings are upward. Traces were selected to illustrate current amplitude substates (*). A, the internal solution contained 5 mM Na+ and 150 mM K+ and the external solution contained 155 mM Na+ and 5 mM K+. B, internal and external solutions were symmetrical, with 5 mM Na+ and 150 mM K+. C, current- membrane potential (Vm) curves from two inside-out patches in symmetrical 5 mM [Na+]o plus different K+ gradients (substituting Na+ for K+) with 10 μM [Ca2+]i. Ratios indicated are for Ko+:Ki+ (both mM). Current-voltage relations were fitted to the theoretical potassium current using a modified Goldman current equation that included a term used to subtract the sodium component (Methods, eqn (2)).
Figure 3
Figure 3. Effects of [Ca2+]i on BK open probability
A, representative unitary KCa current in an inside-out patch recorded at +60 mV in symmetrical K+ (150 mM) and in various [Ca2+]i. B, the effect of [Ca2+]i on open probability (Po). Each point represents the average of 3-8 single-channel patch recordings at a holding potential (Vh) of +60 mV. The data are fitted to a dose-response curve with a Po(max) of 0.72 and a KD of 4.8 × 10⁻⁷. Inset: Hill plot derived from the first 5 points after normalizing to Po(max). A Hill coefficient of 2.0 was estimated as the slope of a straight line fit to the log-log plot.
Figure 5
Figure 5. Intracellular Ca2+ modulates the steady-state kinetics of the BK channel
Single-channel current fluctuations were recorded at various [Ca2+]i levels in inside-out patches held at +60 mV in symmetrical 150 mM K+ solutions. A, fitted dwell-time histograms are shown for a typical single-channel recording (e.g. Fig. 3A). Open times (left panels) were fitted with double exponentials and closed times (right panels) with three exponentials, with the time constants indicated on each panel. The fastest time constants (τ1, square brackets) in each case were too short to be measured reliably and were used for fitting purposes only. The numbers in parentheses show the fractional contribution of each component to the area under the curve. B, open (left) and closed (right) time constants for the reliably measured slow (τ2, ▪, left; τ3, ▴, right), intermediate (τ2, ▿, right) and mean time constants (□). Results are from the data in Fig. 5A.
Figure 6
Figure 6. Voltage modulates the steady-state kinetics of the KCa channel. Inside-out patches, exposed to symmetrical 150 mM K+ solutions with 100 μM [Ca2+]i, were held at various membrane potentials
A, fitted dwell-time histograms for a representative single-channel patch held at four membrane potentials. Data were analysed and are presented as in Fig. 5. B, open (left) and closed (right) time constants for the reliably measured slow (τ2, ▪, left; τ3, •, right) and mean time constants (□, ^) averaged for 4 single-channel patches.
Figure 8
Figure 8. BK single-channel current is recruited by prepulses favouring Ca2+ entry
Depolarizing pulses to +80 mV (above, Erev) were applied from a holding potential of -60 mV to the same cell-attached patch containing multiple BK channels either without (all left panels) or following (all right panels) a 5 ms prepulse to 0 mV. A, examples of individual sweeps. B, currents calculated as the average of 100 traces. C, histograms of latency to first opening after the pulse to +80 mV. D, all-points amplitude histograms with (left panel) and without (right panel) a prepulse. Each peak above 0 pA corresponds to one open channel. The pipette contained SES with 10 mM CaCl2 while the bath contained 150 mM K+ solution.
Figure 9
Figure 9. A depolarizing prepulse can increase the open probability of a single BK channel in a cell-attached patch
Test pulses were given to +80 mV (above, Erev) from a holding potential of -60 mV. Four individual current traces and their respective ensemble average of 200 traces (below) are shown in the absence of a prepulse (A) or following a 10 ms prepulse to -20 mV (B) or +80 mV (C) in the same patch. Recording solutions were as in Fig. 8. D, subtraction of ensemble current in C from that in B shows the current activated by the -20 mV prepulse (ensemble average current). For clarity, the current during the prepulse has been blanked. The scale bar for the ensemble currents is 1 pA. E, time to first opening of BK channels after the onset of the test pulse to +80 mV without (left) or following (right) a prepulse to -20 mV. Data are pooled from 1200 sweeps from 6 calyces. The smooth curves were fitted to double exponential functions with time constants of 23.5 and 81.6 ms in the control (no prepulse) and 12.0 and 62.4 ms in the prepulse group.

Similar articles

Cited by

References

    1. Anderson AJ, Harvey AL, Rowan EG, Strong PN. Effects of charybdotoxin, a blocker of Ca2+-activated K+ channels, on motor nerve terminals. British Journal of Pharmacology. 1988;95:1329–1335. - PMC - PubMed
    1. Art JJ, Wu Y-C, Fettiplace R. The calcium-activated potassium channels of turtle hair cells. Journal of General Physiology. 1995;105:49–72. - PMC - PubMed
    1. Astrand P, Stjarne L. A calcium-dependent component of the action potential in sympathetic nerve terminals in rat tail artery. Pflügers Archiv. 1991;418:102–108. - PubMed
    1. Bartschat DK, Blaustein MP. Calcium-activated potassium channels in isolated presynaptic nerve terminals from rat brain. The Journal of Physiology. 1985;361:441–457. - PMC - PubMed
    1. Bielefeldt K, Jackson MB. A calcium-activated potassium channel causes frequency-dependent action-potential failures in a mammalian nerve terminal. Journal of Neurophysiology. 1993;70:284–298. - PubMed

MeSH terms

LinkOut - more resources