. 1999 Jul 15;13(14):1871-83.
doi: 10.1101/gad.13.14.1871.

Collisions between yeast chromosomal loci in vivo are governed by three layers of organization

Affiliations

Collisions between yeast chromosomal loci in vivo are governed by three layers of organization

S M Burgess et al. Genes Dev. .

Abstract

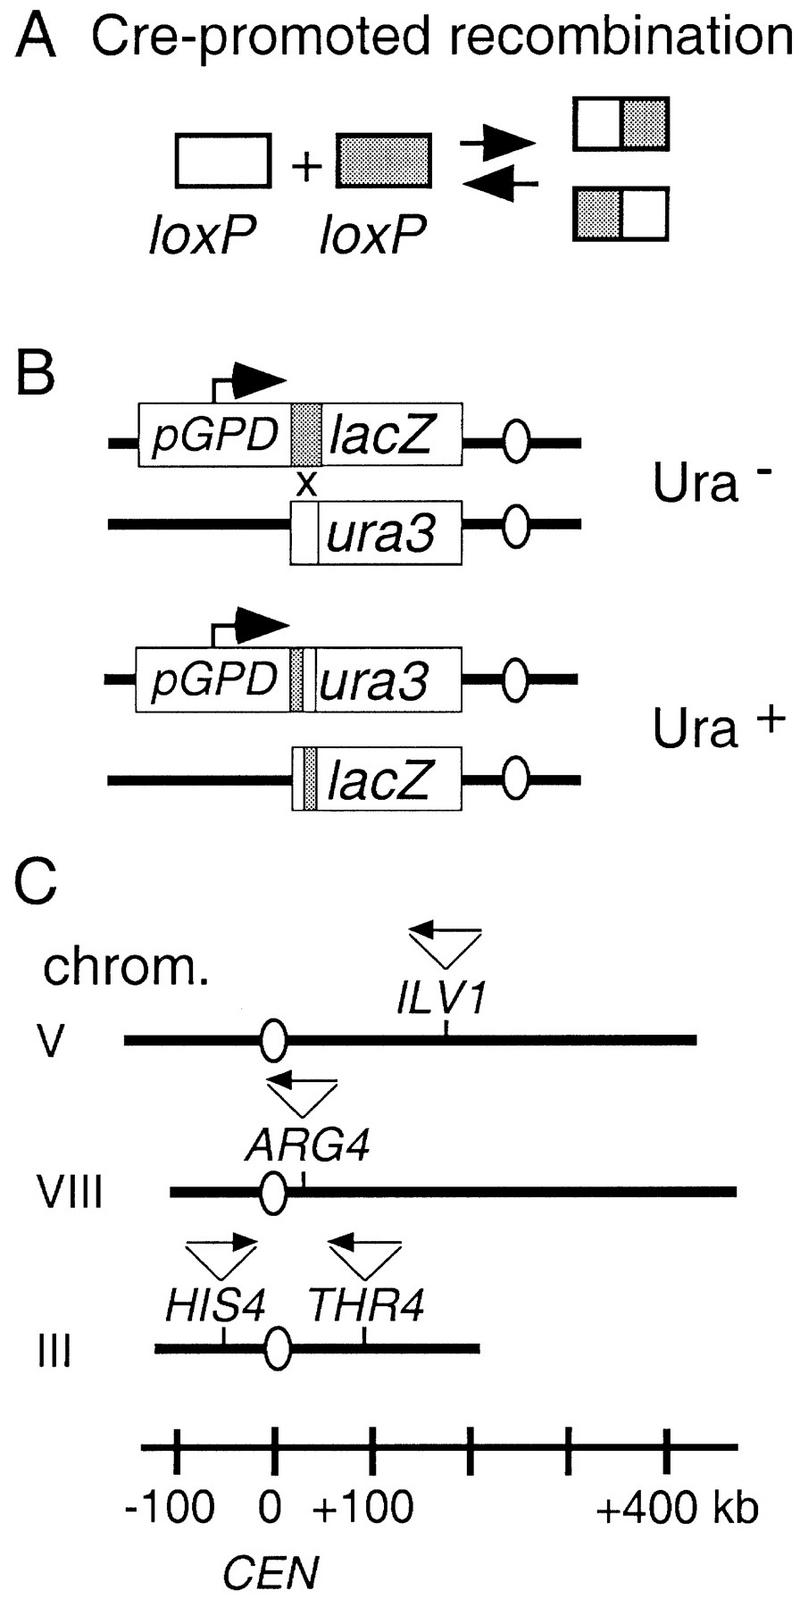
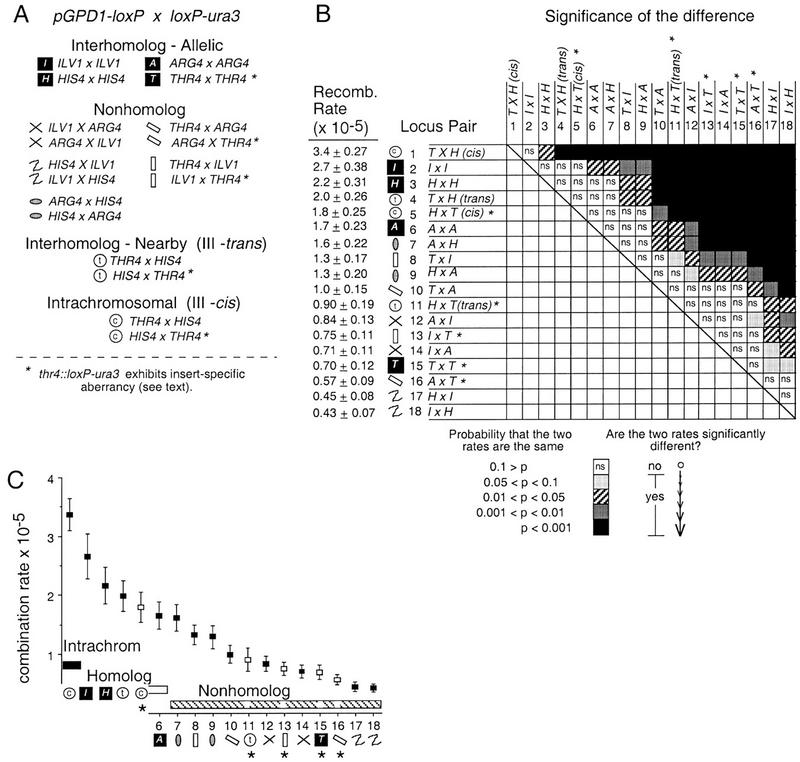
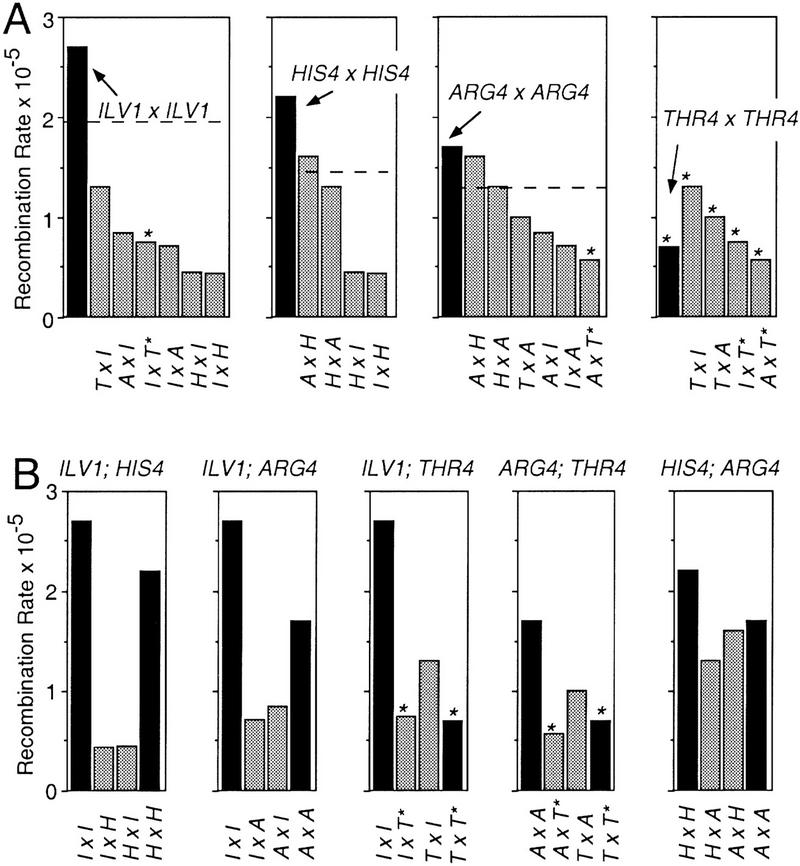
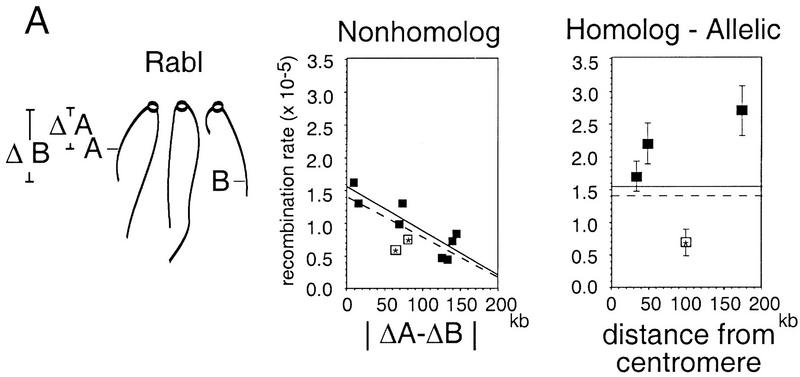
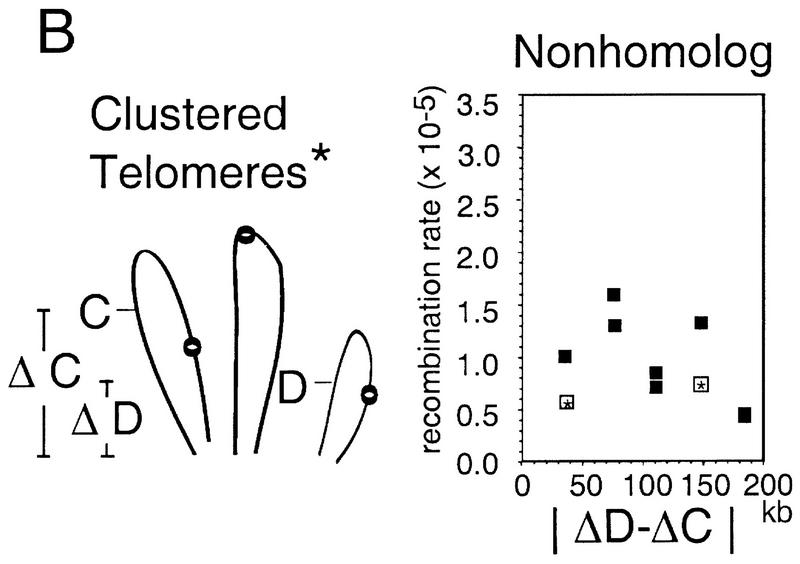
The relative probabilities that different pairs of chromosomal loci will collide with one another in vegetatively growing diploid yeast cells have been assessed using a genetic assay for Cre/loxP site-specific recombination. Recombination rates have been determined for 18 different pairs of loxP sites representing diverse pairs of positions within the genome. Overall, relative collision probabilities vary over an eightfold range. Within this range, a hierarchy comprising three levels of organization can be discerned. First, collisions between loci on nonhomologous chromosomes are governed by nonspecific centromere clustering. Second, a sequence is closer to allelic or nearby sequences on its homolog than to sequences on nonhomologous chromosomes, an effect most simply attributed to homolog pairing. Third, a sequence can be closer to other sequences nearby on the same chromosome than to sequences on other chromosomes. These findings provide a framework for assessing the role of chromosome disposition in cellular processes such as DNA repair and gene expression. Also the possibility is raised that genome-wide coalignment of homologs is not the fundamental raison d'etre of the somatic pairing process. We suggest instead that pairing may exist to promote juxtaposition of homologous regions within irregular genome complements.


Figures

Figure 1
Figure 1
Cre/loxP recombination assay. (A) Cre-mediated recombination occurs between two 34-bp loxP sites (shown in white and gray boxes). (B) Cre/loxP recombination creates a pGPD1–loxP–ura3 fusion and a Ura+ phenotype. (C) Position and orientation of loxP sites integrated into the yeast genome for this study. The loxP sites are oriented so that recombination between sites located on two chromosomes results in the reciprocal exchange of chromosome arms. For loxP sites located on the same chromosome (e.g., at THR4 and HIS4) recombination results in an inversion of the region between the two loci. The position of the centromere is represented by an open circle.
Figure 2
Figure 2
Recombination rates among 18 pairs of loci containing loxP site constructs. (A) Four different types of interactions were measured by Cre/loxP recombination: (1) interhomolog-allelic: loxP sites located at allelic positions on homologous chromosomes, (2) nonhomolog: loxP sites located on nonhomologous chromosomes, (3) interhomolog-nearby: loxP sites at nonallelic positions on homologous chromosomes, and (4) intrachromosomal: loxP sites on the same physical chromosome. Reciprocal pairs of loxP tester constructs are denoted by the same symbol. (B) For each strain, a recombination rate (± s.d.) was determined by fluctuation analysis and is reported in descending rank order at left. Loci are abbreviated by the first letter of the locus name. The type of loxP site insertion is always represented as pGPD1–loxP–lacZ × loxP–ura3. The probability of any two measured rates being different from one another was determined by a two-tailed z-test. Results of this analysis are indicated in the matrix by the appropriate shading corresponding to the calculated p value (ns, not significant). (C) Plot of recombination rate values for all 18 strains (identified by number in B) in descending rank order from left to right. The type of chromosome interaction being measured is indicated by the same symbols as in A and B. Strains containing the thr4::loxP–ura3 construct are marked with an asterisk and are not included within the groupings as indicated by lack of shading (see text for details).
Figure 3
Figure 3
Allelic rates versus related nonhomolog rates. (A) Each interhomolog-allelic recombination rate (black bars) is shown separately with all related nonhomolog recombination rates (gray bars). The broken line in each panel represents a value equal to two standard deviations from the mean interhomolog recombination rate (95% confidence level). (Asterisks) Strains containing the thr4::loxP–ura3 construct, which behaves aberrantly (see text for details). (B) Interhomolog-allelic rates for any two loci are shown with the two related reciprocal nonhomolog rates as in A.
Figure 4
Figure 4
Relative contributions of the Rabl orientation and homolog pairing to Cre/loxP recombination rates. (A) The Rabl configuration of chromosomes with centromeres marked by open circles is shown. The distance in kb each loxP site is from its respective centromere is denoted by ΔA and ΔB (left). Each nonhomolog recombination rate is plotted against the absolute difference in the distance the two sites are from their respective centromeres (|ΔA − ΔB|; middle). The correlation between the relative position of loxP sites in the Rabl and the observed recombination rate is significant (broken line, R2 = 0.59, P < 0.01). For eight points, not including the thr4::loxP–ura3 construct (open boxes with asterisks), this significance is even greater (solid line, R2 = 0.77, P < 0.01). The y intercepts of the fitted lines from the left-hand plot (where |ΔA − ΔB| = 0) represent minimum rates expected for two allelic loci by virtue of their relative chromosome position in the Rabl orientation. Significant differences from these values are observed for the HIS4 × HIS4, ILV1 × ILV1, and THR4 × THR4 pairs (z-test, P < 0.05). (B) No contribution of telomere clustering on Cre/loxP recombination rates between nonhomologous chromosomes is detected. (Asterisk) One of many possible arrangements of telomeres within the nucleus that was tested. For this particular arrangement, each nonhomolog rate is plotted against the absolute difference in distance each site is from the nearest telomere (|ΔD − ΔC|). No significant effect on recombination rate was found for loxP sites positioned in this particular arrangement (R2 = 0.19, P > 0.1) or in other related variations (not shown).
Figure 4
Figure 4
Relative contributions of the Rabl orientation and homolog pairing to Cre/loxP recombination rates. (A) The Rabl configuration of chromosomes with centromeres marked by open circles is shown. The distance in kb each loxP site is from its respective centromere is denoted by ΔA and ΔB (left). Each nonhomolog recombination rate is plotted against the absolute difference in the distance the two sites are from their respective centromeres (|ΔA − ΔB|; middle). The correlation between the relative position of loxP sites in the Rabl and the observed recombination rate is significant (broken line, R2 = 0.59, P < 0.01). For eight points, not including the thr4::loxP–ura3 construct (open boxes with asterisks), this significance is even greater (solid line, R2 = 0.77, P < 0.01). The y intercepts of the fitted lines from the left-hand plot (where |ΔA − ΔB| = 0) represent minimum rates expected for two allelic loci by virtue of their relative chromosome position in the Rabl orientation. Significant differences from these values are observed for the HIS4 × HIS4, ILV1 × ILV1, and THR4 × THR4 pairs (z-test, P < 0.05). (B) No contribution of telomere clustering on Cre/loxP recombination rates between nonhomologous chromosomes is detected. (Asterisk) One of many possible arrangements of telomeres within the nucleus that was tested. For this particular arrangement, each nonhomolog rate is plotted against the absolute difference in distance each site is from the nearest telomere (|ΔD − ΔC|). No significant effect on recombination rate was found for loxP sites positioned in this particular arrangement (R2 = 0.19, P > 0.1) or in other related variations (not shown).

References

    1. Ambremski K, Hoess R, Sternberg N. Studies on the properties of P1 site-specific recombination: Evidence for topologically unlinked products following recombination. Cell. 1983;32:1301–1311. - PubMed
    1. Bender JC. Cytosine methylation of repeated sequences in eukaryotes: The role of DNA pairing. Trends Biochem Sci. 1998;23:252–256. - PubMed
    1. Berben G, Dumont J, Gilliquet V, Bolle PA, Hilger F. The YDp plasmids: A uniform set of vectors bearing versatile gene disruption cassettes for Saccharomyces cerevisiae. Yeast. 1991;7:475–477. - PubMed
    1. Beumer KJ, Pimpinelli S, Golic KG. Induced chromosomal exchange directs the segregation of recombinant chromatids in mitosis of Drosophila. Genetics. 1998;150:173–188. - PMC - PubMed
    1. Bliska JB, Cozzarelli NR. Use of site-specific recombination as a probe of DNA structure and metabolism in vivo. J Mol Biol. 1987;194:205–218. - PubMed

Publication types

LinkOut - more resources