

Depth penetration and detection of pH gradients in biofilms by two-photon excitation microscopy
- PMID: 10427041
- PMCID: PMC91526
- DOI: 10.1128/AEM.65.8.3502-3511.1999
Depth penetration and detection of pH gradients in biofilms by two-photon excitation microscopy
Abstract
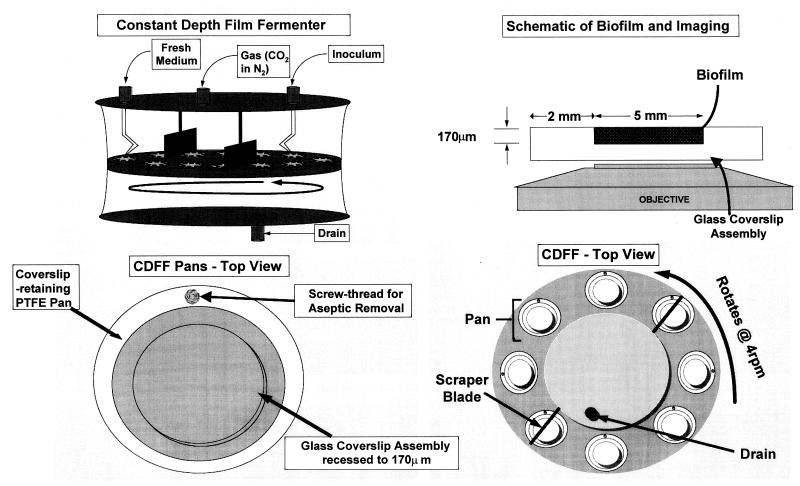
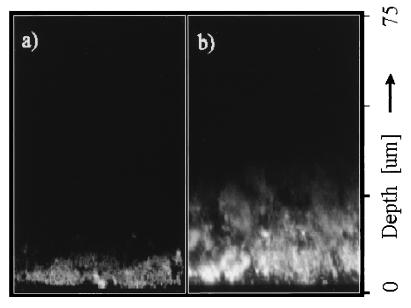
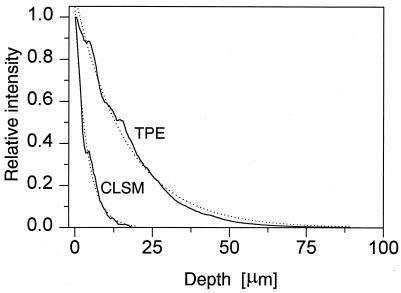
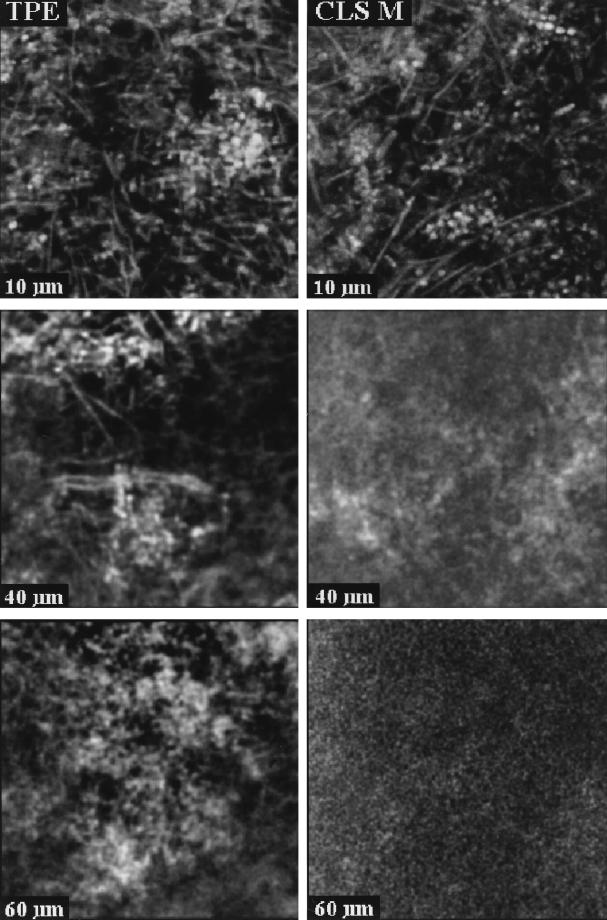
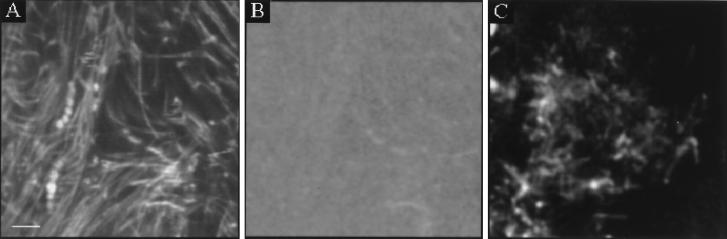
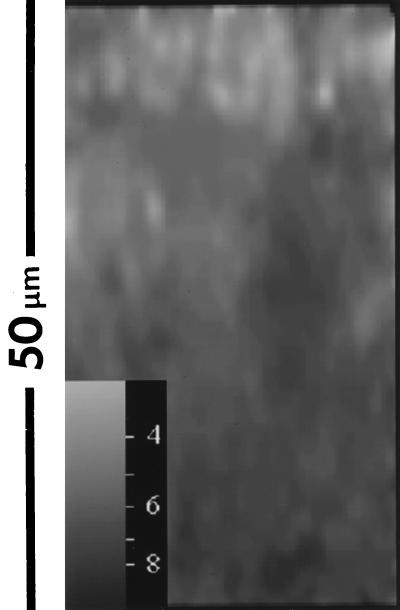
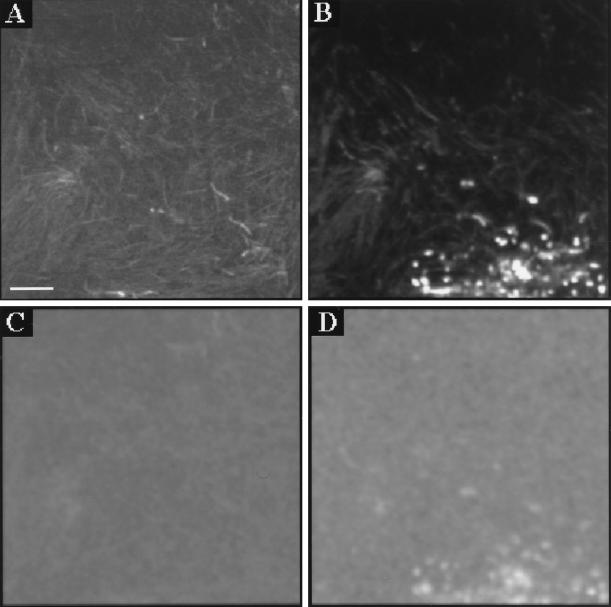
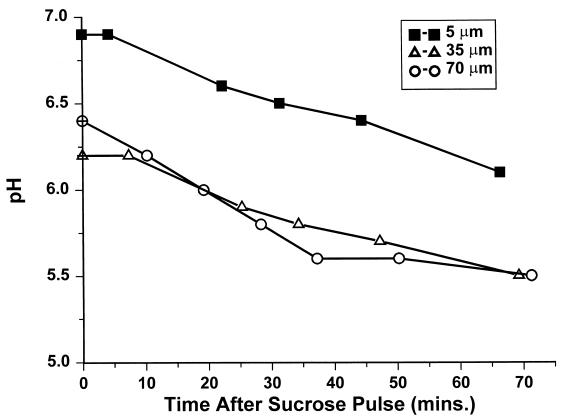
Deep microbial biofilms are a major problem in many industrial, environmental, and medical settings. Novel approaches are needed to understand the structure and metabolism of these biofilms. Two-photon excitation microscopy (TPE) and conventional confocal laser scanning microscopy (CLSM) were compared quantitatively for the ability to visualize bacteria within deep in vitro biofilms. pH gradients within these biofilms were determined by fluorescence lifetime imaging, together with TPE. A constant-depth film fermentor (CDFF) was inoculated for 8 h at 50 ml. h(-1) with a defined mixed culture of 10 species of bacteria grown in continuous culture. Biofilms of fixed depths were developed in the CDFF for 10 or 11 days. The microbial compositions of the biofilms were determined by using viable counts on selective and nonselective agar media; diverse mixed-culture biofilms developed, including aerobic, facultative, and anaerobic species. TPE was able to record images four times deeper than CLSM. Importantly, in contrast to CLSM images, TPE images recorded deep within the biofilm showed no loss of contrast. The pH within the biofilms was measured directly by means of fluorescence lifetime imaging; the fluorescence decay of carboxyfluorescein was correlated with biofilm pH and was used to construct a calibration curve. pH gradients were detectable, in both the lateral and axial directions, in steady-state biofilms. When biofilms were overlaid with 14 mM sucrose for 1 h, distinct pH gradients developed. Microcolonies with pH values of below pH 3.0 were visible, in some cases adjacent to areas with a much higher pH (>5.0). TPE allowed resolution of images at significantly greater depths (as deep as 140 microm) than were possible with CLSM. Fluorescence lifetime imaging allowed the in situ, real-time imaging of pH and the detection of sharp gradients of pH within microbial biofilms.
Figures


References
-
- Baelum V, Fejerskov O, Küseler A. Approximal plaque pH following topical applications of standard buffers in vivo. Caries Res. 1994;28:116–122. - PubMed
-
- Barber P, Boyd A, Newman H N, Challacombe S J, Vrahopoulos T P, Gill S. Immunogold labelling of Porphyromonas gingivalis in pure culture and in apical border plaque. Microb Ecol Health Dis. 1990;3:217–222.
-
- Brading M, Jass J, Lappin-Scott H M. Dynamics of bacterial biofilm formation. In: Lappin-Scott H M, Costerton J W, editors. Plant and microbial biotechnology research series, no. 5. Microbial biofilms. Cambridge, United Kingdom: Cambridge University Press; 1995. pp. 46–63.
-
- Bradshaw D J, McKee A S, Marsh P D. Effects of carbohydrate pulses and pH on population shifts within oral microbial communities in vitro. J Dent Res. 1989;68:1298–1302. - PubMed
-
- Buurman E P, Sanders R, Draaijer A, Gerritsen H C, van Veen J J F, Houpt P M, Levine Y K. Fluorescence lifetime imaging using a confocal laser scanning microscope. Scanning. 1992;14:152–159.
Publication types
MeSH terms
Substances
LinkOut - more resources
Full Text Sources
Other Literature Sources
