

Rapid fluorescence assessment of the viability of stressed Lactococcus lactis
- PMID: 10427066
- PMCID: PMC91551
- DOI: 10.1128/AEM.65.8.3681-3689.1999
Rapid fluorescence assessment of the viability of stressed Lactococcus lactis
Abstract
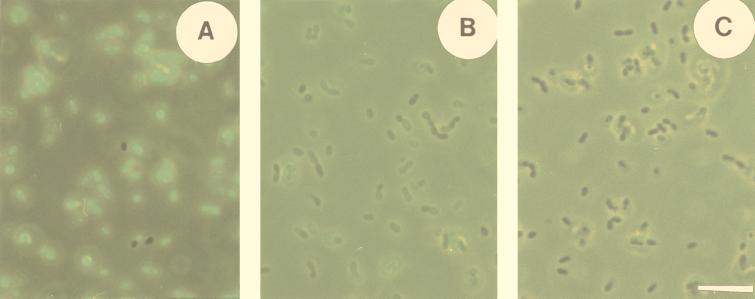
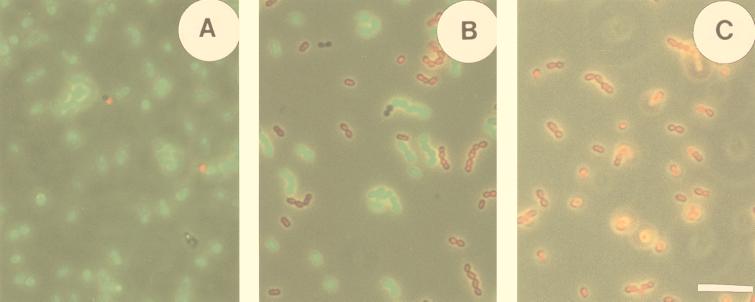
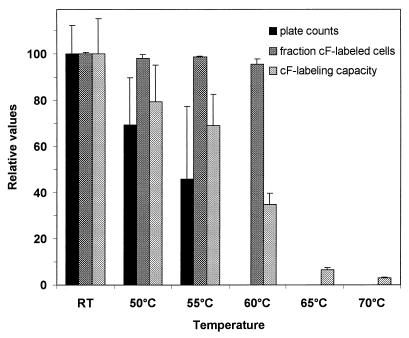
The aim of this study was to establish the use of the fluorescent probes carboxyfluorescein (cF) and propidium iodide (PI) for rapid assessment of viability, using Lactococcus lactis subsp. lactis ML3 exposed to different stress treatments. The cF labeling indicated the reproductive capacity of mixtures of nontreated cells and cells killed at 70 degrees C very well. However, after treatment up to 60 degrees C the fraction of cF-labeled cells remained high, whereas the survival decreased for cells treated at above 50 degrees C and was completely lost for those treated at 60 degrees C. In an extended series of experiments, cell suspensions were exposed to heating, freezing, low pH, or bile salts, after which the colony counts, acidification capacity, glycolytic activity, PI exclusion, cF labeling, and cF efflux were measured and compared. The acidification capacity corresponded with the number of CFU. The glycolytic activity, which is an indicator of vitality, was more sensitive to the stress conditions than the reproduction, acidification, and fluorescence parameters. The cF labeling depended on membrane integrity, as was confirmed by PI exclusion. The fraction of cF-labeled cells was not a general indicator of reproduction or acidification, nor was PI exclusion or cF labeling capacity (the internal cF concentration). When the cells were labeled by cF, a subsequent lactose-energized efflux assay was needed for decisive viability assessment. This novel assay proved to be a good and rapid indicator of the reproduction and acidification capacities of stressed L. lactis and has potential for physiological research and dairy applications related to lactic acid bacteria.
Figures
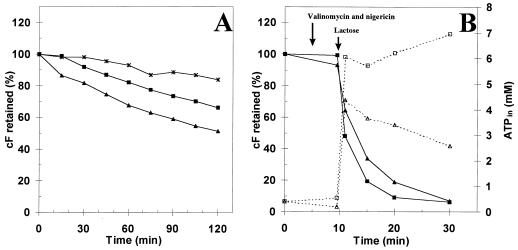
 ); exposure to 1.0% CBS, 100% = 105 μM (●); and exposure to 0.02% DBS, 100% = 136 μM (◊).
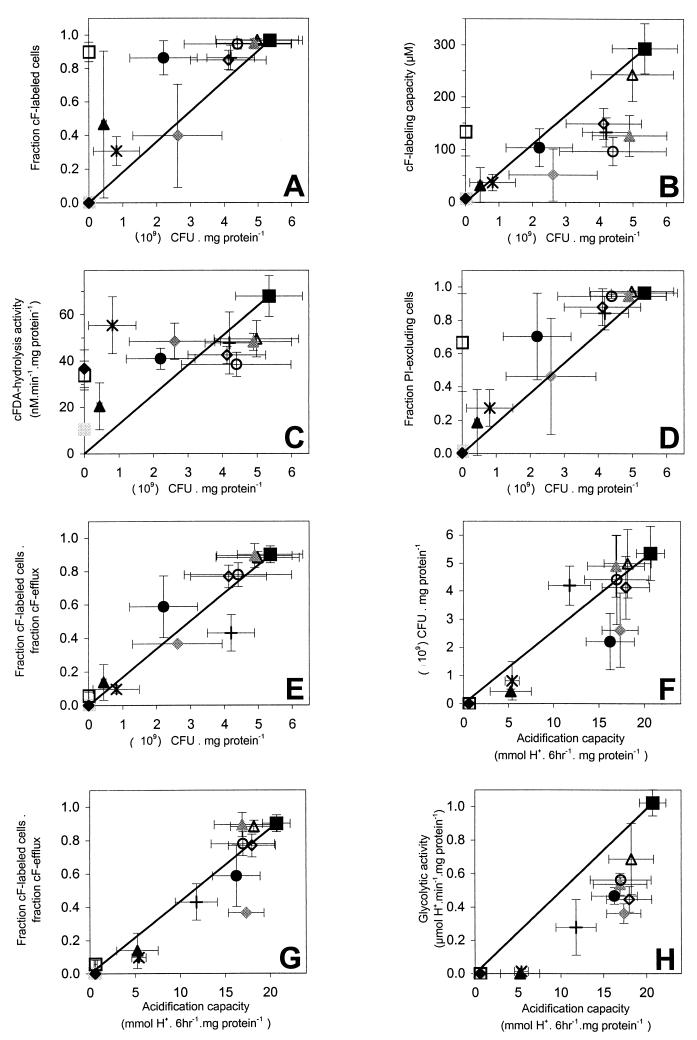
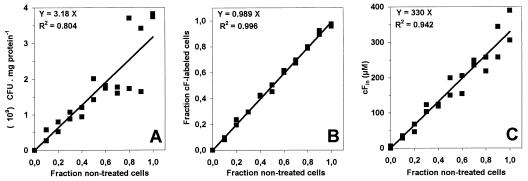
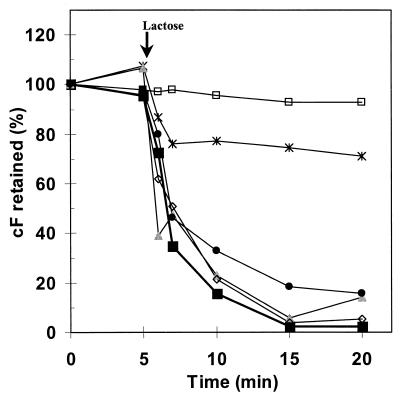
 ), exposure to 60°C for 90 s (□), exposure to −20°C for 24 h (∗), exposure to −20°C and 30% glycerol for 24 h (+), exposure to pH 7.0 (▵), exposure to pH 5.0 (), exposure to pH 2.0 (▴), exposure to 0.2% CBS (○), exposure to 1.0% CBS (●), exposure to 0.02% DBS (◊), exposure to 0.06% DBS (
 ), and exposure to 1.0% DBS (⧫). The error bars indicate the standard deviations. The bold lines indicate the optimal situation, that is, linear regression through the origin and the point for the non-treated-cell suspensions.
References
-
- Bascomb S. Enzyme tests in bacterial identifications. Methods Microbiol. 1987;19:105–160.
-
- Diaper J P, Edwards C. The use of fluorogenic esters to detect viable bacteria by flow cytometry. J Appl Bacteriol. 1994;77:221–228.
-
- Dodd C E R, Waites W M. The use of cryosectioning and histological staining to detect the sites of microbiological growth in British fresh sausages. J Appl Bacteriol. 1989;67:xvii.
Publication types
MeSH terms
Substances
LinkOut - more resources
Full Text Sources
Other Literature Sources
Research Materials
Miscellaneous
