Long-term two-photon fluorescence imaging of mammalian embryos without compromising viability
- PMID: 10429240
- PMCID: PMC5087329
- DOI: 10.1038/11698
Long-term two-photon fluorescence imaging of mammalian embryos without compromising viability
Abstract
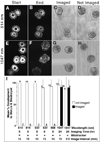
A major challenge for fluorescence imaging of living mammalian cells is maintaining viability following prolonged exposure to excitation illumination. We have monitored the dynamics of mitochondrial distribution in hamster embryos at frequent intervals over 24 h using two-photon microscopy (1,047 nm) while maintaining blastocyst, and even fetal, developmental competence. In contrast, confocal imaging for only 8 h inhibits development, even without fluorophore excitation. Photo-induced production of H2O2 may account, in part, for this inhibition. Thus, two-photon microscopy, but not confocal microscopy, has permitted long-term fluorescence observations of the dynamics of three-dimensional cytoarchitecture in highly photosensitive specimens such as mammalian embryos.
Figures


Similar articles
-
Growth factors protect in vitro cultured embryos from the consequences of oxidative stress.Zygote. 2004 Aug;12(3):231-40. doi: 10.1017/s0967199404002783. Zygote. 2004. PMID: 15521713
-
Three-dimensional laser scanning two-photon fluorescence confocal microscopy of polymer materials using a new, efficient upconverting fluorophore.Scanning. 1996 Nov;18(8):562-6. doi: 10.1002/sca.4950180805. Scanning. 1996. PMID: 8946771
-
Assessment of DNA damage in individual hamster embryos by comet assay.Mol Reprod Dev. 1999 Sep;54(1):1-7. doi: 10.1002/(SICI)1098-2795(199909)54:1<1::AID-MRD1>3.0.CO;2-0. Mol Reprod Dev. 1999. PMID: 10423291
-
Molecular photobleaching kinetics of Rhodamine 6G by one- and two-photon induced confocal fluorescence microscopy.Chemphyschem. 2005 May;6(5):791-804. doi: 10.1002/cphc.200400509. Chemphyschem. 2005. PMID: 15884061 Review.
-
Optical sectioning microscopy with planar or structured illumination.Nat Methods. 2011 Sep 29;8(10):811-9. doi: 10.1038/nmeth.1709. Nat Methods. 2011. PMID: 21959136 Review.
Cited by
-
Multiphoton microscopy applied for real-time intravital imaging of bacterial infections in vivo.Methods Enzymol. 2012;506:35-61. doi: 10.1016/B978-0-12-391856-7.00027-5. Methods Enzymol. 2012. PMID: 22341218 Free PMC article.
-
Phototoxicity of BODIPY in long-term imaging can be reduced by intramolecular motion.Photochem Photobiol Sci. 2022 Sep;21(9):1677-1687. doi: 10.1007/s43630-022-00250-y. Epub 2022 Jul 7. Photochem Photobiol Sci. 2022. PMID: 35796875
-
Two-Photon-Excited Single-Molecule Fluorescence Enhanced by Gold Nanorod Dimers.Nano Lett. 2022 May 25;22(10):4215-4222. doi: 10.1021/acs.nanolett.2c01219. Epub 2022 May 16. Nano Lett. 2022. PMID: 35575461 Free PMC article.
-
Image improvement of temporal focusing multiphoton microscopy via superior spatial modulation excitation and Hilbert-Huang transform decomposition.Sci Rep. 2022 Jun 16;12(1):10079. doi: 10.1038/s41598-022-14367-8. Sci Rep. 2022. PMID: 35710746 Free PMC article.
-
Imaging cytosolic translocation of Mycobacteria with two-photon fluorescence resonance energy transfer microscopy.Biomed Opt Express. 2014 Oct 20;5(11):3990-4001. doi: 10.1364/BOE.5.003990. eCollection 2014 Nov 1. Biomed Opt Express. 2014. PMID: 25426325 Free PMC article.
References
-
- Terasaki M, Dailey ME. In: Handbook of biological confocal microscopy. Pawley JB, editor. New York: Plenum; 1995. pp. 327–346.
-
- Hillman N, Tasca R. Ultrastructural and autoradiographic studies of mouse cleavage stages. Am. J. Anat. 1983;126:151–174. - PubMed
-
- Batten BE, Albertini DF, Ducibella T. Patterns of organelle distribution in mouse embryos during preimplantation development. Am. J. Anat. 1987;178:204–213. - PubMed
-
- Holy J, Simerly C, Paddock S, Schatten G. Three-dimensional imaging of fertilization and early development. J. Electron Microsc. Technol. 1991;17:384–400. - PubMed
-
- Capco DG, Gallicano GI, McGaughey RW, Downing KH, Larabell CA. Cytoskeletal sheets of mammailian eggs and embryos: a lattice-like network of intermediate filaments. Cell Motil. Cytoskeleton. 1993;24:85–99. - PubMed
Publication types
MeSH terms
Substances
Grants and funding
LinkOut - more resources
Full Text Sources
Other Literature Sources

